Download
1 / 22
220 likes | 357 Vues
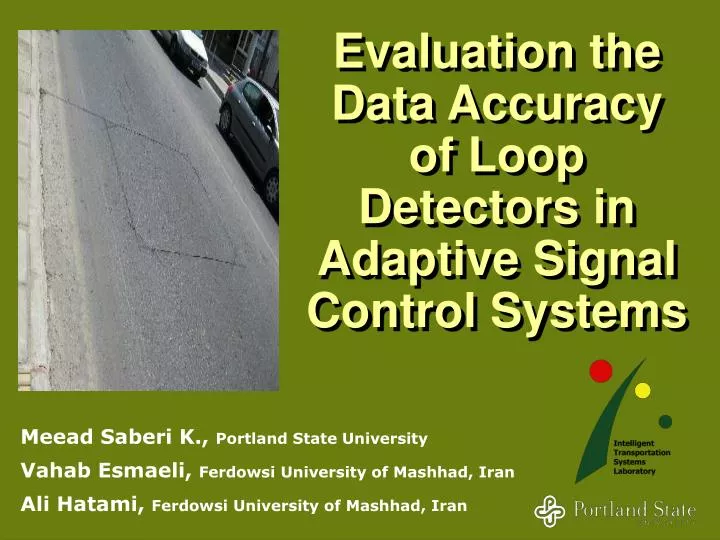
Evaluation the Data Accuracy of Loop Detectors in Adaptive Signal Control Systems. Meead Saberi K., Portland State University Vahab Esmaeli, Ferdowsi University of Mashhad, Iran Ali Hatami, Ferdowsi University of Mashhad, Iran. Objective.

E N D
Evaluation the Data Accuracy of Loop Detectors in Adaptive Signal Control Systems Meead Saberi K., Portland State University Vahab Esmaeli, Ferdowsi University of Mashhad, Iran Ali Hatami, Ferdowsi University of Mashhad, Iran
Objective • How accurate are the loop detectors data (count data)? • Is there any relationship between traffic volume and error rate of count data? • What are the reasons for error?
Study Area IRAN • Khayyam – Malek Abad intersection • Modarres – Emam Khomeini intersection • Sanabad – Kolahdooz intersection • Rah Ahan intersection • Sajjad – Bozorgmehr intersection • Daraie Intersection 6 main urban intersections in Mashhad city (white square points on the map)
Data Quality “Data quality is the fitness of data for all purposes that require it. Measuring data quality requires an understanding of all intended purposes for that data” Turner, S., Defining and Measuring Traffic Data Quality Texas Transportation Institute Cambridge Systematics Inc, 2002. Accuracy Completeness Validity Timeliness Coverage Accessibility
Methodology Study approaches were categorized into approaches with two, three and four lanes in which one loop detector installed in each lane. Archived traffic volume data, aggregated at 15 minutes intervals, of each approach during the study period were used. Recorded videos during the same periods were processed manually by two persons to count the actual number of passenger cars, heavy vehicles, motorcycles, and bicycles pass the detectors.
Error Ratio Actual traffic volume Detected traffic volume Error ratio is positive which means the actual traffic volume is smaller than the volume which loops are detected . Error ratio is negative which means the actual traffic volume is greater than the detected number by loop detectors.
Hypothetical Relationship Volume vs. Error
Next Step Expanding the sample size to prove the relationship between volume and error
Acknowledgement • Traffic Control Center of Mashhad • Ferdowsi University of Mashhad, Iran • STEP, Portland State University
Questions? Thanks