Download
1 / 23
230 likes | 753 Vues
MONITORING CHLORIDE USING CONDUCTIVITY DATA LOGGERS PRESENTED TO THE LAKE CHAMPLAIN RESEARCH CONFERENCE 2018 January 9, 2018. Presented By. www.watershedca.com. Chloride – Sources and Impacts Chloride Standards Sampling Methods Data and Results Temperature/Precipitation Effects

E N D
MONITORING CHLORIDE USING CONDUCTIVITY DATA LOGGERS PRESENTED TO THE LAKE CHAMPLAIN RESEARCH CONFERENCE 2018 January 9, 2018 Presented By www.watershedca.com
Chloride – Sources and Impacts • Chloride Standards • Sampling Methods • Data and Results • Temperature/Precipitation Effects • Seasonality www.watershedca.com
Where does chloride come from? Agricultural Runoff Wastewater Treatment Water Softeners Natural Sources – Soil/Rock and Water Interactions Road Deicing www.watershedca.com
How does chloride affect flora and fauna? • Chloride can: • Replace soil nutrients otherwise available to plants • ‘Salts’ will absorb groundwater otherwise available to plant roots • Chloride ions accumulate in plant leaves and interfere with chlorophyll production and photosynthesis • In Fauna: • Chloride ions release toxic metals from soil – • This can inhibit nutrient availability and decrease DO www.watershedca.com
Chloride Levels – Natural and Water Quality Standards Precipitation and Natural Levels Vary - ~1mg/L is typical. Chloride in Drinking Water is a Secondary (Non-Enforced) Criteria for aesthetics. At 250 mg/L water tastes salty. Chronic Impairment is a four-day average that occurs once every three years. Acute Impairment is a one-hour average that occurs less than once every three years. www.watershedca.com
Measuring Chloride in Surface Water • Equipment • Sample Site Setup • Conductivity and Specific Conductance – relationship • Chloride and Specific Conductance – relationship • Developing a Regression Equation • Vermont’s Regression Equation • Chloride Trends to Expect • Seasonality – Winter vs. Summer • Precipitation / Melt Effects by Season • Weather Data and Data Analysis www.watershedca.com
Equipment Selection Price: ~$2,495.00 • Benefits – • Long Battery Life - ~5 years at 15 minute intervals • High-accuracy Measurement (+/- 0.5%) • Low Drift • Factory Calibrated • Measurements • Conductivity • Specific Conductance • Water Temperature • Salinity • Total Dissolved Solids • Pressure • Resistivity • Water Density • Other Equipment: • Cable and Lock • ~3’ PVC (perforated) • Laptop or tablet • Sample Bottles www.watershedca.com
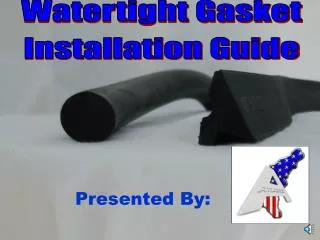
Sample Site Setup Probe Deployed in PVC pipe for protection Probe Location Cable and Lock Pressure Vent www.watershedca.com
Sample Site Setup The Cage Upgrade (Thanks to the Town and Village of Essex) Protective Cage Anchor Cable and Lock www.watershedca.com
Sample Site Setup Probe connects to laptop for data download www.watershedca.com
Conductivity and Specific Conductance - relationship Conductivity – measurement of ability of water to conduct electricity Increased by dissolved salts in water (ions) Measures in microSiemens or microohmos per centimeter Specific Conductance – corrected conductivity for temperature (normalized) www.watershedca.com
Specific Conductance and Chloride- relationship • Relationship: • Develop Simple Linear Regression – y = mx + b • Collect water samples for chloride analysis at same time logger measures SC • Match them together to create regression • Limitations: • If n (number of samples) is low, regression isn’t overly predictive (low R-squared) • If sampled events are all from high Cl concentration sites, regression misses low/middle events (under-predicts) www.watershedca.com
Specific Conductance and Chloride- relationship VT - New Cl Regression 2016: Chloride (mg/L) = 0.292 * [Specific Conductance Value (uS/cm)] - 69.72 R-squared: 0.94 (good) n -= 441 www.watershedca.com
Chloride Trends to Expect Summer Winter Summer Decreased Precipitation = Increased Chloride Increased Precipitation = Decreased Chloride Increased Temperature = Increased Chloride www.watershedca.com
Data Winter Spring Summer Winter www.watershedca.com
Data – Winter Patterns • General Trends – • Cl levels generally higher in winter • When Temp rises, Cl rises • When temp lowers, Cl lowers • ~Linear Relationship Temp Increase (melt) Chloride Increase www.watershedca.com
Data – Winter Patterns Chloride Increase Snow Events (and deicing) www.watershedca.com
Data – Spring Patterns Chloride Reduction (dilution) Precipitation Event (rain) www.watershedca.com
Data – Summer Patterns Precipitation Event (rain) Chloride Decrease (dilution) www.watershedca.com
Data – Fall Patterns Winter Patterns Summer Patterns www.watershedca.com
Weather Data – to understand patterns http://www.nrcc.cornell.edu/ • Why NRCC? • They can provide daily, 1-hour interval measurements of temperature and precipitation • Better than NOAA – NOAA data isn’t up to date yet • For 15-minute logging – you have to interpolate data from 1-hour to 15-minute increments • $5/month, $14 service charge annually Contact: Jessica Spaccio nrcc@cornell.edu www.watershedca.com
Resources: • Chloride Assessment of Select Urban Streams in Chittenden County VT – July 1007 – VT DEC • Data Report for Chloride TMDL for Waterbodies in the I-93 Corridor – December 2007 - NH DES • NH I-93 Corridor Chloride TMDL – Quality Assurance Project Plan – June 2006 – NH DES • Estimating Chloride Concentrations of Road-Salt Constituents in Highway-Runoff from Measurements of Specific Conductance – 1999 – USGS (Granato and Smith) www.watershedca.com
Questions? Contact dana@watershedca.com www.watershedca.com www.watershedca.com