Download
1 / 18
180 likes | 274 Vues
Differential O2 Absorption Barometric Pressure Radar (DIAR_BAR): Improvements in Tropical Storm Forecasts Qilong Min 1 , Bing Lin 2 , Yongxiang Hu 2 , Wei Gong 1 , Steven Harrah 2 , Wes Lawrence 3 , Dion Fralick 2 , 1 State University of New York, Albany, NY

E N D
Differential O2 Absorption Barometric Pressure Radar (DIAR_BAR): Improvements in Tropical Storm Forecasts Qilong Min1, Bing Lin2, Yongxiang Hu2 , Wei Gong1, Steven Harrah2, Wes Lawrence3, Dion Fralick2, 1State University of New York, Albany, NY 2NASA Langley Research Center, Hampton, VA 3Old Dominion University, Norfolk, VA
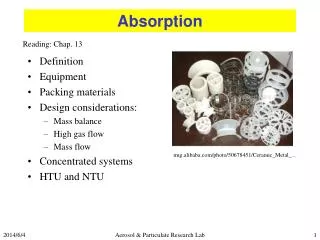
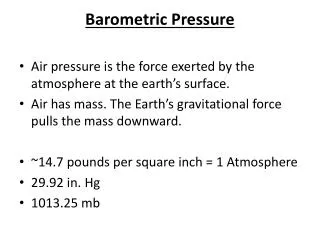
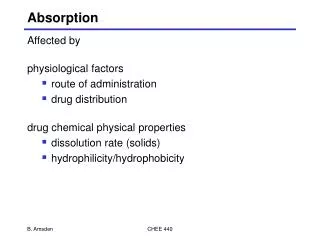
moored buoy dropsonde No remote sensing technique is available. Sea surface pressure measurements Atmospheric pressure : the primary driving force for atmospheric dynamics and generates wind fields that transport mass, moisture and momentum. • Spatial coverage: very limited • Costs: high • Uncertainty: ~1 mb Existing techniques: in-situ drift buoy
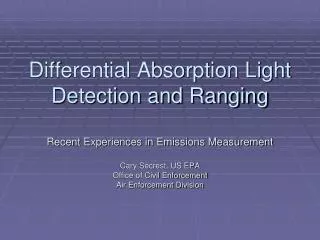
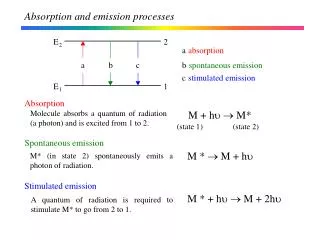
Historical studies • Active & passive O2 A-band instruments active: high stable laser system --- difficult passive: daytime, cloud free, aerosol loading • Microwave sounder 25 ~ 75GHz: multiple channels (6) absorption: LW, WV atmospheric and cloud temperature footprints, sea surface reflectivities
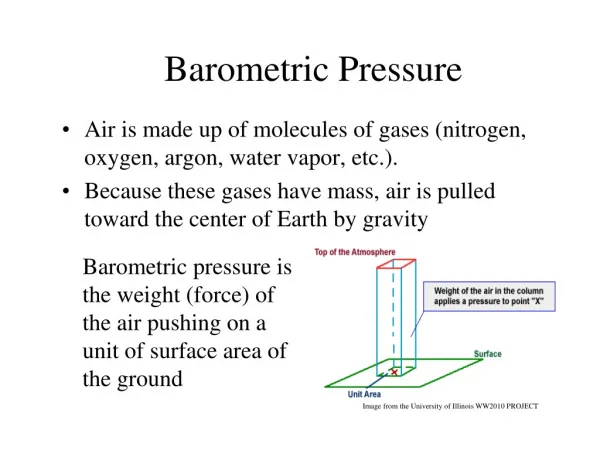
Attenuation Measurement Concept Oxygen is uniformly mixed in the atmosphere, and attenuates the transmitted signal – less at lower freq. and more at higher freq. Aircraft/Spacecraft-Based Q-Band (50-56GHz) Radar Calibrated PRecw/o Attenuation PRec f or 1/l (50~56GHz) The amount of attenuation is directly related to barometric pressure and altitude.
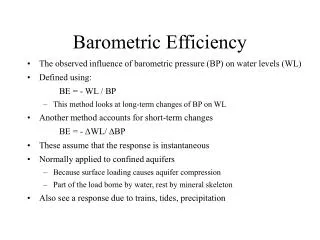
Theoretical basis Pr () = PTAe2(, )0(, , )/(4R2()) (1) Pr: radar received power; T: transmittance () exp (OLV) = exp (OOLLVV) (2) where O = MP0/g, M: mixing ratio; P0: sea surface pressure Pr(1)/Pr(2)=C(1)C(2)-1exp(-2 (O(1)-O(2))MOPO/g). (3) power ratio of two frequency channels at the O2-band Similar LW & WV absorption (50~56GHz) Almost the same in footprint & reflectivity P0 C0(1, 2) + C1(1, 2) loge(Pr(1)Pr-1(2)) (4) A very simple near-linear relationship between surface air pressure and radar power ratio of two different frequencies (or differential absorption index) is expected from the O2 band radar data.
Radar simulated results Most of the variability is due to global atmospheric profile variations: temperature, water vapor, clouds, etc.
PoC Instrument Development SpaceK Labs 45GHz Up/Down Converter Agilent 8362B Network Analyzer Quinstar 24" Cassegrain Antennas
Ground tests relatively isolated radar reflector Projected Beamwidth • nearly spherical reflector • ~300m clear range Radar Installed in/on Mobile Radar Lab
Supported by VDOT Ground tests Measure Water NRCS Over Wide Inc. Ang. Support Satellite Design Varina-Enon Bridge I-295 South of Richmond, VA Approx. 150’ above James River
Flight tests PATAUXENT RIVER NAVAL AIR STATION
Technology Roadmap Proof-of-Concept Instrument LEO Satellite Instrument Airborne Instrument 0 – 3 km >220 km 15 ~ 22 km • COTS & Lab Equip. • Demo Concept • Operational Design • Op. Perf. Assessment • Technology Readiness Level from 3 to 7 • GlobalMeasurements
Sea level pressure (SLP) assimilation (WRF) • “Simulated satellite SLP” using surface pressure measurements during first landing of Katrina • Model configuration • Advanced Research WRF (ARW) dynamic solver • CCM3 Radiation • Thompson cloud microphysics and Kain-Fristch convective parameterization • Mellor-Yamada PBL • 36 and 12 km horizontal resolution and 28 layers, 261×181 grid mesh • 84 -hour simulation
Sea level pressure (SLP) assimilation (WRF) Sea-Level Pressure at 00 UTC August 26, 2005 e OBS Gl_.25 Ga_.25 f NCEP-FNL Gl_1.0 Ga_1.0
Sea level pressure (SLP) assimilation (WRF) Initial column wind vector (m/s) in the experiments CTL Gl(.25) Ga(1.0) • The assimilation runs symmetrically strengthen the cyclonic flow and enhances the westward and southward mean flow. • Due to deepening of the hurricane vortex, the convective heating is enhanced Gl(.25)-CTL Ga(1.0)-CTL
Hurricane Katrina tracks Gl Ga • Single point assimilations have large spread in track when different length scales are used • All points assimilations have small spread in track and produce close track and landing position Thick Black soild—best estimate Black dashed—CTL Sensitivity to scale length factor Black –1; Red—0.75; Green—0.5 and Black—0.25
Hurricane Katrina Intensity (84-hour: Gl, Ga, Gc and Gb) Without center pressure, Gc simulates comparable results as Ga, indicating the effect of pressure horizontal distribution in assimilation.
Summary This differential O2 absorption radar technique may dramatically extend the current, limited-point barometric capability over oceans with airborne and spaceborne instruments. • The differential O2 absorption pressure radar will provide the first remote sensing barometric data! The accuracy of instantaneous surface air pressure measurements could be ~4mb. (grid averages: errors ~1mb) • Lab, ground, and flight tests of current prototype instrument indicate that it works • Next generation radar: operational capability • This effort will lead significant improvements in predictions of hurricane intensities and tracks.