Download
1 / 1
10 likes | 129 Vues
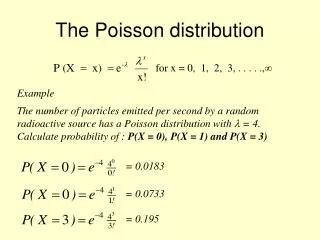
Result #3:. # Failures/yr = #Units * S l i = 7.20. Reliability Analysis of a Low Voltage Power Supply Design for the Front-End Electronics of the ATLAS Tile Calorimeter. Gary Drake, Member IEEE , James Proudfoot Argonne National Laboratory, Lemont, IL USA.

E N D
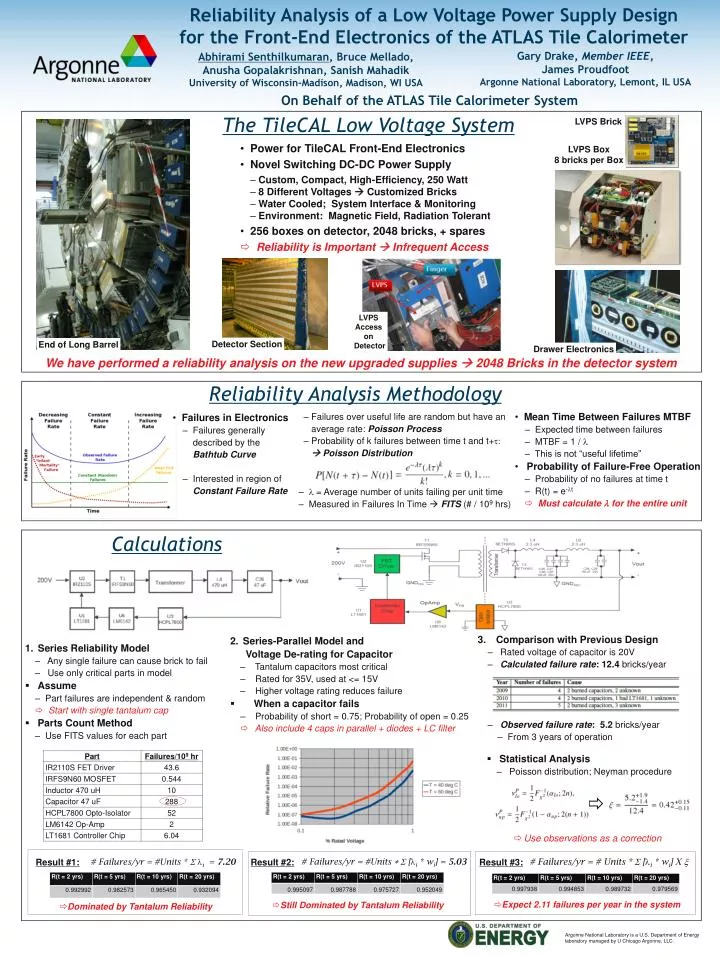
Result #3: # Failures/yr = #Units * Sli = 7.20 Reliability Analysis of a Low Voltage Power Supply Design for the Front-End Electronics of the ATLAS Tile Calorimeter Gary Drake, Member IEEE, James Proudfoot Argonne National Laboratory, Lemont, IL USA Abhirami Senthilkumaran, Bruce Mellado, Anusha Gopalakrishnan, Sanish Mahadik University of Wisconsin-Madison, Madison, WI USA On Behalf of the ATLAS Tile Calorimeter System The TileCAL Low Voltage System LVPS Brick • Power for TileCAL Front-End Electronics • Novel Switching DC-DC Power Supply • Custom, Compact, High-Efficiency, 250 Watt • 8 Different Voltages Customized Bricks • Water Cooled; System Interface & Monitoring • Environment: Magnetic Field, Radiation Tolerant • 256 boxes on detector, 2048 bricks, + spares • Reliability is Important Infrequent Access LVPS Box 8 bricks per Box LVPS Access on Detector Detector Section End of Long Barrel Drawer Electronics We have performed a reliability analysis on the new upgraded supplies 2048 Bricks in the detector system Reliability Analysis Methodology • Mean Time Between Failures MTBF • Expected time between failures • MTBF = 1 / l • This is not “useful lifetime” • Probability of Failure-Free Operation • Probability of no failures at time t • R(t) = e-lt • Must calculate l for the entire unit • Failures over useful life are random but have an average rate: Poisson Process • Probability of k failures between time t and t+t: Poisson Distribution • Failures in Electronics • Failures generally described by the Bathtub Curve • Interested in region of Constant Failure Rate • l = Average number of units failing per unit time • Measured in Failures In Time FITS (# / 109 hrs) Calculations • Comparison with Previous Design • Rated voltage of capacitor is 20V • Calculated failure rate: 12.4 bricks/year • Observed failure rate: 5.2 bricks/year • From 3 years of operation • Series-Parallel Model and • Voltage De-rating for Capacitor • Tantalum capacitors most critical • Rated for 35V, used at <= 15V • Higher voltage rating reduces failure • When a capacitor fails • Probability of short = 0.75; Probability of open = 0.25 • Also include 4 caps in parallel + diodes + LC filter • Series Reliability Model • Any single failure can cause brick to fail • Use only critical parts in model • Assume • Part failures are independent & random • Start with single tantalum cap • Parts Count Method • Use FITS values for each part • Statistical Analysis • Poisson distribution; Neyman procedure • Use observations as a correction # Failures/yr = # Units * S [li * wi] X x # Failures/yr = #Units * S [li * wi] = 5.03 Result #1: Result #2: • Expect 2.11 failures per year in the system • Still Dominated by Tantalum Reliability • Dominated by Tantalum Reliability