Download
1 / 13
130 likes | 281 Vues
Using Data to Promote Student Success. Analyzing and Interpreting EQAO Results. Guiding Principles:. Large-scale assessment provides comparable year-to-year data on student achievement that can be helpful to schools and boards in improvement planning

E N D
Using Data to Promote Student Success Analyzing and Interpreting EQAO Results
Guiding Principles: • Large-scale assessment provides comparable year-to-year data on student achievement that can be helpful to schools and boards in improvement planning • Results should be considered in conjunction with other school information related to student performance • Each school, and school community, is unique and results need to be interpreted in context • It is important to use caution when interpreting percentage results where numbers are small
4 Cs of Interpreting Data Are the data: • Complete? • Consistent? • Comparative? • Concealing? Source: Assessment Training Consortium/ Ottawa Carlton District School Board
Complete • Large-scale assessment is a snapshot • Consider other information: • Classroom assessments, report cards • District assessments • Surveys • Demographic data • School characteristics Source: Assessment Training Consortium/ Ottawa Carlton District School Board
Consistent: Are there any surprises? • Are results from different sources consistent? • e.g. EQAO and report cards • Are results consistent with expectations? • Consider consistencies with respect to: • Individual students • School results • Past experience Source: Assessment Training Consortium/ Ottawa Carlton District School Board
Comparisons • Norms (school vs. provincial data) • Similar schools • Curriculum standard • Sub-groups (e.g. boys/girls, different programs) • Trends over time Source: Assessment Training Consortium/ Ottawa Carlton District School Board
Concealing • Look at distribution of scores • Averages may be misleading, esp. if numbers are small Source: Assessment Training Consortium/ Ottawa Carlton District School Board
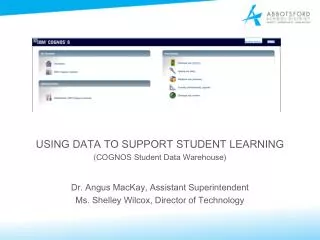
Contextual Data • EQAO sources: • Demographics of eligible/participating students • Participation rates • Student Questionnaire responses • Principal Questionnaire responses • Other sources: • Socio-economic data • Enrollment patterns • Mobility rates • Absenteeism rates
Contextual Data • Key Questions: • How do the current contextual and demographic data for your school compare with previous years? • How does your school’s demographic information compare with that of the board and province? • How do your school’s exemption, deferral and absentee rates compare with the board and province? • Does your school have significant numbers of ESL/ELD or special education students? • What do students report about computer access and use and reading and writing outside of school?
Achievement Data • EQAO sources: • Detailed School Results • Item Information Reports • Student Questionnaire responses • Teacher Questionnaire responses • Other sources: • Report card data • District assessments • Classroom assessments • Reading assessments • Diagnostic assessments
Achievement Data • Key Questions: • How do overall results compare over time? • Is the pattern of results similar to those of the board or province? • How do the overall results compare to those of similar schools? • Are there differences in the performance of males and females? • Is the performance of ESL/ELD students significantly different from that of other students?
Item Information Reports:Ideas for Reviewing Reports • Identify the strong performance areas in the school • On which items did your school perform well? • Identify the performance areas that require attention • Which items presented a challenge for your students? • Where do you expect the school to be in relation to the Board and Province? • Relate other data to the observations • Consider what improvement strategies are indicated for the areas needing attention
Examining your data: • Involves a process of asking questions and searching for meaning • Provides insight into strengths and weaknesses • Is only one step in the process of school improvement