Download
1 / 30
300 likes | 390 Vues
Higher Education Academy NTF Project: 2010/13 The Forgotten Year: Tackling the ‘Sophomore Slump’. Project team Clare Milsom, Martyn Stewart, Sue Thompson, Wayne Turnbull, Margaret Williams, Mantz Yorke , Elena Zaitseva. The Forgotten Year: is there a second year slump? Schedule

E N D
Higher Education Academy NTF Project: 2010/13 The Forgotten Year: Tackling the ‘Sophomore Slump’ Project team Clare Milsom, Martyn Stewart, Sue Thompson, Wayne Turnbull, Margaret Williams, MantzYorke, Elena Zaitseva
The Forgotten Year: is there a second year slump? Schedule • 1200 – 1220 Lunch • 1220 – 1315 Welcome and Overview • 1315 – 1400 Discussion in groups • 1400 – 1430 Moving forward
Our vision is for students in UK higher education to enjoy the highest quality learning experience in the world Our vision is for students in UK higher education to enjoy the highest quality learning experience in the world Our vision is for students in UK higher education to enjoy the highest quality learning experience in the world
UMF Repositioning: evidence - student record data Undergraduate performance (2008) on 24 credit modules across the institution (7131 modules) Work with Ruth Ogden
% Students achieving ‘good honours’ Other findings: Levels 1 and 2: students perform significantly higher on Semester 1 modules Level 3: students perform best on 36 credit modules (usually dissertation modules) and least well on 12 credit modules.
‘Sophomore slump’coined by Freedman (1956) Extends beyond education to a second effort not living up to former expectations: “second season syndrome”....... Difficult second album syndrome Period of developmental confusion and uncertainty?
Characteristics of the Second Year Experience Strengthened programme focus Low(er) academic self efficacy (Stuart Hunter et al. 2010) Less informal social integration and involvement (Foubert and Grainger 2006) Increased absenteeism (Wilder 1993) – Faculty of Science Intense period of personal development NSS 2010 ‘Big increase in the amount of work between years 2 and 3 so not as prepared as possible.’ ‘Took me nearly half my time into second year before I realised I need to adjust my style of writing.’ ‘Lack of information on how course works will be assessed, especially at Level 2’ ‘ Some of the lab work, in particular in 2nd year is not overly relevant’
Project aims: Characterise the dip: pervasive or local. Discipline effect? Investigate causes and develop strategies for enhancing Y2 experience. Develop a model for analysing institutional datasets worthy of transfer.
Year-on-year increase Mean grade 22 (44.9%) No. ‘good’ degrees 23 L1 L2 L3 Second-year slump Mean grade 20 (40.8%) No. ‘good’ degrees 19 L1 L2 L3 Second-year peak Mean grade 6 (12.2%) No. ‘good’ degrees 6 L1 L2 L3 Year-on-year decrease Mean grade 1 (2.0%) No. ‘good’ degrees 1 L1 L2 L3 No. Good degrees most reliable indicator
‘Soft Applied’ (applied social sciences, health) 24 49% SA ‘Soft Pure’ (humanities and pure social sciences) 15 31% SP ‘Hard Applied’ (e.g. technology & engineering) 7 14% HA ‘Hard Pure’ (e.g.physical & natural sciences) 3 6% HP Year-on-year increase (n=22) 59% (13) SA, 27% (6) SP, 9% (2) HP,5% (1) HA Second-year slump (n=20) 55% (11) SA, 25% (5) SP, 15% (3) HA, 5% (1) HP Second-year peak (n=6) 50% (3) SP, 33% (2) HA, 17% (1) SA, L1 Year-on-year decrease (n=1) 1 HA
Two patterns dominate. In both cases L3 marks tend to be significantly higher even after L3 formula removed. Yearly increase in performance Characterised by normal distribution of grades across levels (77% of cases) Second-year slump Greater tendency for skewed mark distributions, particularly at L1 & L3 L1 L2 L3 L1 L2 L3 Indicative second year slump pattern tends to be: L1 & L3 = negative skew (weighted in upper grades) L2 = positive skew (weighted in lower grades) Signals an issue with marking practices?
Percentage of good degrees awarded L1 L2 L3 62% -5 57% +5 62% 66% -14 52% +7 59% 48% -9 39% +31 70% 41% -2 39% +10 49% 38% -3 35% +10 45% 52% -19 33% +45 78% 33% -5 28% +8 36% 43% -16 27% +8 35% 30% -6 24% +34 58% 39% -15 24% +25 49% 25% -3 22% +28 50% 45% -27 18% +23 41% 19% -2 17% +41 58% 47% -32 15% +6 21% 14% -3 11% +14 25% 28% -18 10% +35 45% 30% -20 10% +47 57% 21% -14 7% +22 29% 6% -1 5% +22 27%
An analysis of selected Level 1 modules Mantz Yorke 23 February 2011
NOTE This analysis is limited to Level 1 modules in which there were 30 or more results from students who took the module only once in Academic Year 2008-09 It is the first phase of a sequence that is intended to span Levels 1 – 3, and will include all first-time attempts. This should eliminate the upward bias in the present results
So why the variation? • Lots of variables may have exerted influence, including: • Student calibre (entry qualifications; commitment) • Nature of the subject (hard/soft; pure/applied) • Curriculum design • Pedagogic quality • Resourcing • Expected standards (intended learning outcomes) • Mode of assessment • Nature of the assessment demand • Marker variability (in some cases, due to differences in School) • Disentangling the effects of these is very difficult!
So why the variation? • Lots of variables may have exerted influence, including: • Student calibre (entry qualifications; commitment) • Nature of the subject (hard/soft; pure/applied) • Curriculum design • Pedagogic quality • Resourcing • Expected standards (intended learning outcomes) • Mode of assessment • Nature of the assessment demand • Marker variability (in some cases, due to differences in School)
Nature of the subject: hard/soft; pure/applied Judgements regarding the categorisation of modules are rough and ready
Hard Pure N=38 Hard Applied N=29 Soft Pure N=104 Soft Applied N=146 24 Standard Deviation 20 16 12 8 4 Module Mean 40 45 50 55 60 65 70 75
Mode of assessment In-class tests are treated as exams
Mean CW = <35% CW = 35-75% CW = >75% Civil engineering surveying 1, CW=30% 65+ 60-64.99 55-59.99 50-54.99 <50 BUE HSS LBS LSA LSS NSP
What about equivalence in assessment demand? • 12 credit modules at level 1 specify, for example, • CW 100% (proj docs 60%; oral pres 25%; use e-portfolio for PDP exercise 15%) • CW 100% (essay 1500w) • CW 100% (portfolio 3000w) • CW 100% (group annotated bibliography 20%; portfolio 3000w 80%) • CW 100% (portfolio of resources based on workshop, 2000w equiv) • CW 100% (info retrieval exercise 20%; PPT pres 40%; group pres 40%) • CW 100% (discuss 3 poems 30%; 40-50 lines + comment 50%; wkshp part 20%) • CW 100% (2 phase tests @25%ea; practical report 25%; fieldwork report 25%) • CW 50% Ex 50% (CW = seminar contrib’n 10%; essay 1200w 40%; Ex = 1hr) • CW 50% Ex 50% (CW = seminar presentation; Ex = 1hr) • CW 50% E 50% (CW = 1500-2000w report and presentation; E=1hr unseen) • Ex 100% (Ex = seen exam 2hrs) • Ex 100% (Ex = 1 question based on a case study 1.5hrs) • Ex 100% (Ex = 2hrs) • Ex 100% (Ex = 1.5hrs)
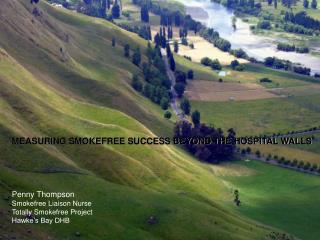
Attendance data analysis: How to get the most out of Reggie: An analysis of attendance data since Sept 2009. Phil Denton Faculty of Science • Throughout this presentation, average % attendances are calculated using total attended and total absent data: Not by simply averaging over individual % class attendances.
How to get the most out of Reggie: An analysis of attendance data since Sept 2009. • Phil Denton Faculty of Science % Attendance vs. Level • A contribution to the ‘second year slump’?
1315 – 1400 Discussion in groups What might be institutional implications? What might be implications for curriculum and assessment? What might be implications for student experience? One person from the project team will make notes