Download
1 / 41
440 likes | 711 Vues
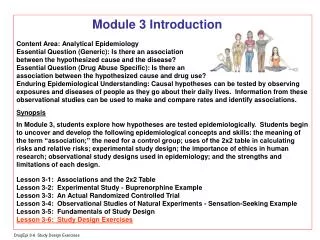
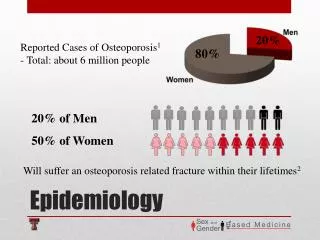
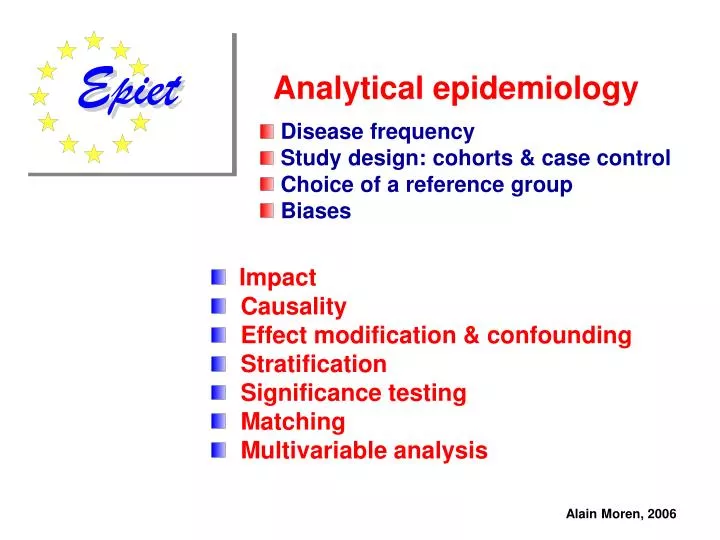
Analytical epidemiology. Impact Causality Effect modification & confounding Stratification Significance testing Matching Multivariable analysis. Disease frequency Study design: cohorts & case control Choice of a reference group Biases. Alain Moren, 2006.

E N D
Analytical epidemiology • Impact • Causality • Effect modification & confounding • Stratification • Significance testing • Matching • Multivariable analysis Disease frequency Study design: cohorts & case control Choice of a reference group Biases Alain Moren, 2006
Exposure Outcome Third variable
Two main complications (1) Effect modifier (2) Confounding factor - useful information - bias
To analyse effect modification To eliminate confounding Solution = stratification stratified analysis Create strata according to categories inside the range of values taken by third variable
Effect modifier Variation in the magnitude of measure of effect across levels of a third variable. Effect modification is not a bias butuseful information Happens when RR or OR is different between strata (subgroups of population)
Effect modifier • To identify a subgroup with a lower or higher risk • To target public health action • To study interaction between risk factors
Vaccine efficacy AR NV - AR V VE = ----------------------------- AR NV VE = 1 - RR
Vaccine efficacy VE= 1 - RR = 1 - 0.28 VE= 72%
Effect modification • Different effects (RR) in different strata (age groups) • VE is modified by age • Test for homogeneity among strata (Woolf test)
Oral contraceptives (OC) and myocardial infarction (MI) Case-control study, unstratified data OC MI Controls OR Yes 693 320 4.8 No 307 680 Ref. Total 1000 1000
Effect function Effect (OR or RR) is a function of the effect modifier Relative risk (RR) of dying from coronary heart disease for smoking physicians, by age groups, England & Wales, RR 6 * 5 4 3 * 2 * * 1 * 10 20 30 40 80 60 70 50 Age Doll et Hill, 1966
Any statistical test to help us? • Breslow-Day • Woolf test • Test for trends: Chi square Heterogeneity
Confounding • Distortion of measure of effect because of a third factor • Should be prevented • Needs to be controlled for
Confounding To be a confounding factor, 2 conditions must be met: Exposure Outcome Third variable Be associated with exposure - without being the consequence of exposure Be associated with outcome - independently of exposure
To identify confounding Compare crude measure of effect (RR or OR) to adjusted (weighted) measure of effect (Mantel Haenszel RR or OR)
Are Mercedes more dangerous than Porsches? 95% CI = 1.3 - 1.8
Crude RR = 1.5 Adjusted RR = 1.1 (0.94 - 1.27)
Car type Accidents Confounding factor: Age of driver
Age Porsches Mercedes < 25 years 550 (55%) 300 (30%) >= 25 years 450 700 Chi2 = 127.9 Age Accidents No accidents < 25 years 370(44%) 480 >= 25 years 130 (11%) 1020 Chi2 = 270.7
Exposure Outcome Hypercholesterolaemia Myocardial infarction Third factor Atheroma Any factor which is a necessary step in the causal chain is not a confounder
Salt Myocardial infarction Hypertension
Any statistical test to help us? When is ORMH different from crude OR ? 10 - 20 %
How to prevent/control confounding? Prevention • Restriction to one stratum • Matching Control • Stratified analysis • Multivariable analysis
k SUM (ai di / ni) i=1 OR MH = ------------------- k SUM (bi cci / ni) i=1 Mantel-Haenszel summary measure Adjusted or weighted RR or OR Advantages of MH • Zeroes allowed
k SUM (ai di / ni) i=1 OR MH = ------------------- k SUM (bi cci / ni) i=1
Effect modifier Belongs to nature Different effects in different strata Simple Useful Increases knowledge of biological mechanism Allows targeting of PH action Confounding factor Belongs to study Weighted RR different from crude RR Distortion of effect Creates confusion in data Prevent (protocol) Control (analysis)
How to conduct a stratified analysis • Perform crude analysisMeasure the strength of association • List potential effect modifiers and confounders • Stratify data according topotential modifiers or confounders • Check for effect modification • If effect modification present, show the data by stratum • If no effect modification present, check for confoundingIf confounding, show adjusted dataIf no confounding, show crude data
How to define strata • In each stratum, third variable is no longer a confounder • Stratum of public health interest • If 2 risk factors, we stratify on the different levels of one of them to study the second • Residual confounding ?
Logical order of data analysis How to deal with multiple risk factors: • Crude analysis • Multivariate analysis 1. stratified analysis 2. modelling linear regression logistic regression
A train can mask a second train A variable can mask another variable