Download
1 / 23
230 likes | 517 Vues
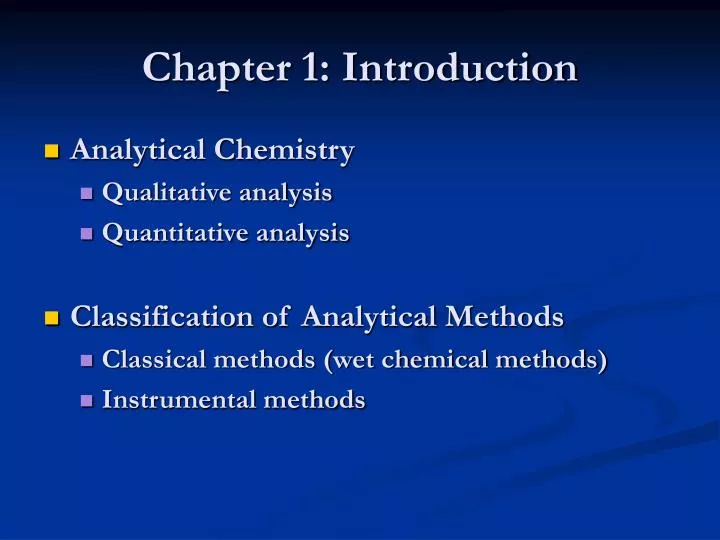
Chapter 1: Introduction. Analytical Chemistry Qualitative analysis Quantitative analysis Classification of Analytical Methods Classical methods (wet chemical methods) Instrumental methods. Comparisons of Wet Chemical and Instrumental Methods. Types of Instrumental Methods

E N D
Chapter 1: Introduction • Analytical Chemistry • Qualitative analysis • Quantitative analysis • Classification of Analytical Methods • Classical methods (wet chemical methods) • Instrumental methods
Types of Instrumental Methods • Separation techniques • Chromatographic • Gas • Liquid • ……. • Electrophoresis • Many types • Detection techniques • Optical spectroscopy • Absorption • Emission • Fluorescence • Mass spectroscopy • Atomic • Molecular
Instruments for Analysis Signal Generator Sample Analytical Signal Input Transducer (Detector) Signal Processor Output Transducer (Readout)
Selection of An Instrumental Method • Defining the problem • Performance characteristics Figure of Merits: Quantitative performance criteria of instruments that are expressed in numerical terms
Precision A measure of the random or indeterminate error Relative Standard Deviation
Bias A measure of the systematic or determinate error Bias = µ - Xt µ - the population mean for the concentration of an analyte Xt – true concentration Standard reference materials (SRM)
Signal Signal x x x x x x x x Sbl Sbl Concentration • Sensitivity A measure of the ability of an analytical method to discriminate between small differences in analyte concentration • Calibration sensitivity (S = mc + Sbl) Concentration
Signal Concentration • Sensitivity • Analytical sensitivity ( = m/sS) m – slope; sS – standard deviation of the measurement Relative insensitive to amplification factors Increase the gain of the instrument by a Factor of two
Sm = Sbl + ksbl Standard deviation of the Blank signal Analytical Signal Blank signal • Detection limit (Limit of detection, LOD) The analyte concentration giving a signal equal the blank signal, Sbl, plus three time standards deviation of the blank, sbl Convert signal response, Sm, to analyte concentration
Sm = Sbl + ksbl Standard deviation of the Blank signal Analytical Signal Blank signal • Dynamic Range Lowest concentration (LOQ) to the concentration where the calibration curve departure from linearity (limit of linearity, LOL) Convert signal response, Sm, to analyte concentration
Guideline for Reporting Data (Recommended by ACS Committee of Environmental Improvement) Analyte Concentration Region of reliability < 3σ Region of Questionable detection (unacceptable) 3σ Detection limit 3σ-10σ Region of less certain quantitation 10σ Limit of quantitation > 10σ Region of quantitation
99.7% Question: When the value of 10 sbl (standard deviation of the blank) is used as LOQ, what is the relative standard deviation of the measurement at this point at the 99.7% confidential level, and why?
Selectivity The degree to which the method is free from interference by other species contained in the sample matrix S = mAcA + mBcB + mCcC + Sbl The selectivitycoefficient for B with respect to A kB,A = mB/mA …………………………………… Note: this is the selectivity of an analytical detection technique
Calibration Methods Analytical response • Comparison with Standard • Direct comparison • Colorimetric • Titration Analyte Concentration
Signal Concentration • Calibration Methods • External Calibration Curve Normally use the method of least squares X X X X
Calibration Methods • External Calibration Curve Two Assumptions: 1. Linear relationship 2. deviation of the individual point from the straight line arises from the error in the measurement
Signal Without sample matrix effect With sample matrix effect (signal suppressed) Concentration • Calibration Methods • Standard Addition
C1, C2, and C3 are the concentrations of analyte after spiked with stnard, with counting the amount of analyte in the original sample solution. C0 is the concentrations of analyte in sample without spiking • Standard Addition C0 C1 C2 C3 Signal x S = mC + Sbl Sample signal Sbl x x C0 =Sbl/m x Conc. of analyte C0 Concentration
Internal Standard Add a substance in a constant amount to all samples and, blanks, and calibration standard in an analysis Sanalyte/Sinternal Concentration