Download
1 / 34
340 likes | 467 Vues
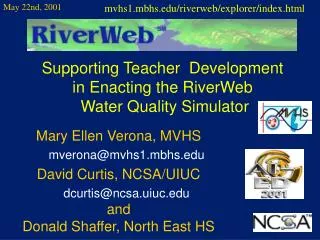
GLORIAD Science Applications Astronomy – Virtual Observatories Global Climate Change Richard M. Crutcher Professor of Astronomy, University of Illinois and Senior Associate Director for Applications, National Center for Supercomputing Applications. What is NCSA?.

E N D
GLORIAD Science ApplicationsAstronomy – Virtual ObservatoriesGlobal Climate ChangeRichard M. CrutcherProfessor of Astronomy, University of IllinoisandSenior Associate Director for Applications,National Center for Supercomputing Applications National Center for Supercomputing Applications
What is NCSA? • United States National Science Foundation funded center operated by the University of Illinois • Provides high-performance computing resources to the U.S. academic community on basis of peer-reviewed proposals • Non-U.S. researchers can collaborate with U.S. researchers and obtain supercomputing resources • NCSA computing resources • 2 TFlop IBM Power 4, AIX operating system • 15 TFlop Pentium 4 Xeon cluster, Linux operating system • 10 TFlop Itanium 2 Teragrid cluster, Linux operating system National Center for Supercomputing Applications
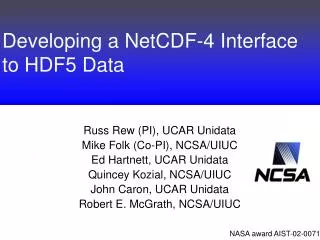
Extensible TeraGrid Facility Caltech: Data collection analysis ANL: Visualization LEGEND Visualization Cluster Cluster IA64 Sun IA32 0.4 TF IA-64 IA32 Datawulf 80 TB Storage 1.25 TF IA-64 96 Viz nodes 20 TB Storage IA64 Storage Server Shared Memory IA32 IA32 Disk Storage Backplane Router Extensible Backplane Network LA Hub Chicago Hub 30 Gb/s 40 Gb/s 30 Gb/s 30 Gb/s 30 Gb/s 30 Gb/s 10 TF IA-64 128 large memory nodes 230 TB Disk Storage 3 PB Tape Storage GPFS and data mining 6 TF EV68 71 TB Storage 0.3 TF EV7 shared-memory 150 TB Storage Server 4 TF IA-64 DB2, Oracle Servers 500 TB Disk Storage 6 PB Tape Storage 1.1 TF Power4 EV7 IA64 Sun EV68 IA64 Pwr4 Sun SDSC: Data Intensive NCSA: Compute Intensive PSC: Compute Intensive National Center for Supercomputing Applications
The National Virtual Observatory National Center for Supercomputing Applications
What is the NVO? • An NSF-funded collaboration of astronomy data providers and IT specialists • A participant in the International Virtual Observatory Association GAVO VO-India KVO IDGAR = National Center for Supercomputing Applications
What is the NVO? Data Grid for Astronomy • Federation of diverse, distributed data & services ~103 catalogs, image archives, data collections currently on-line Archive growth: Sloan Digital Sky Survey: ~3 TB (today) Large Synoptic Telescope: 10 PB/year (2008) • Infrastructure that enables difficult science • handling large datasets • integrating diverse data • integrating computational services • Standards for interoperable information & data exchange National Center for Supercomputing Applications
Example of research with the NVO Cluster Galaxy Morphology Analysis Integrating Grid-based data archives and computations National Center for Supercomputing Applications
Galaxy Morphology: Science Goals • Investigate the dynamical state of galaxy clusters • Study galaxy evolution within context of large-scale structure • Use galaxy morphology as probe of dynamical history: For each galaxy in cluster, calculate three morphological parameters: • Surface Brightness • Concentration Index • Asymmetry Index Compare parameters with other previously measured indicators: magnitude, color, peculiar velocity, position in cluster, x-ray gas emission National Center for Supercomputing Applications
Galaxy Morphology: Procedure • Choose a cluster • Obtain images of cluster from the optical & x-ray bands shows 2 views of the large-scale structure of cluster • Create a catalog of galaxies in the cluster collect interesting properties of galaxies from existing catalogs • Obtain images of individual galaxies “cutouts” from larger images using cutout service • Calculate morphology parameters from image cutouts • Merge calculated values into galaxy catalog • Visualize the results National Center for Supercomputing Applications
Enabling Standards & Technologies • Data Formats • FITS – an existing standard for astronomical images & tables • VOTable – an XML schema for transmitting astronomical tables • Data Access Protocols • Cone Search – for searching catalogs by sky position • Simple Image Access (SIA) – to search for/create images based on sky position HTTP Get Queries return VOTable documents prototypes! • Grid Technologies • Chimera & Pegasus – virtual data catalog and workflow management • Replica Catalog Service – built-in caching of results on the grid • Condor National Center for Supercomputing Applications
How it works Cluster Galaxy Morphology Analysis Portal User’s Machine 1. User selects a cluster web browser National Center for Supercomputing Applications
How it works Cluster Galaxy Morphology Analysis Portal 2. Look up cluster in internally stored catalog clusters User’s Machine 1. User selects a cluster web browser National Center for Supercomputing Applications
How it works 3. X-ray and Optical Images retrieved via SIA interface Chandra SIA Skyview SIA DSS SIA Cluster Galaxy Morphology Analysis Portal 2. Look up cluster in internally stored catalog clusters User’s Machine 1. User selects a cluster web browser National Center for Supercomputing Applications
How it works 3. X-ray and Optical Images retrieved via SIA interface Chandra SIA Skyview SIA DSS SIA Cluster Galaxy Morphology Analysis Portal 2. Look up cluster in internally stored catalog clusters User’s Machine 1. User selects a cluster 4. User launches grid-based analysis web browser National Center for Supercomputing Applications
How it works 3. X-ray and Optical Images retrieved via SIA interface Chandra SIA NED Cone Search Skyview SIA CADC CNOC Cone Search 5. Initial Galaxy Catalog generated via Cone Search DSS SIA Cluster Galaxy Morphology Analysis Portal 2. Look up cluster in internally stored catalog clusters User’s Machine 1. User selects a cluster 4. User launches grid-based analysis web browser National Center for Supercomputing Applications
How it works 3. X-ray and Optical Images retrieved via SIA interface Chandra SIA NED Cone Search Skyview SIA CADC CNOC Cone Search DSS SIA 5. Initial Galaxy Catalog generated via Cone Search DSS SIA CNOC SIA Cluster Galaxy Morphology Analysis Portal 6. Image cutout pointers merged into catalog 2. Look up cluster in internally stored catalog clusters User’s Machine 1. User selects a cluster 4. User launches grid-based analysis web browser National Center for Supercomputing Applications
How it works 3. X-ray and Optical Images retrieved via SIA interface Chandra SIA NED Cone Search Skyview SIA CADC CNOC Cone Search DSS SIA 5. Initial Galaxy Catalog generated via Cone Search DSS SIA CNOC SIA Cluster Galaxy Morphology Analysis Portal 6. Image cutout pointers merged into catalog 2. Look up cluster in internally stored catalog clusters Morphology Calculation Service User’s Machine 1. User selects a cluster 7. Morphological parameters calculated on grid for each galaxy 4. User launches grid-based analysis web browser National Center for Supercomputing Applications
How it works 3. X-ray and Optical Images retrieved via SIA interface Chandra SIA NED Cone Search Skyview SIA CADC CNOC Cone Search DSS SIA 5. Initial Galaxy Catalog generated via Cone Search DSS SIA CNOC SIA Cluster Galaxy Morphology Analysis Portal 6. Image cutout pointers merged into catalog 2. Look up cluster in internally stored catalog clusters Morphology Calculation Service User’s Machine 1. User selects a cluster 7. Morphological parameters calculated on grid for each galaxy 4. 8. User downloads final table and images for analysis, visualization User launches grid-based analysis web browser National Center for Supercomputing Applications
Global Climate Change Major Global Climate Change Concerns • Climate Change (“Global Warming”) • Stratospheric ozone depletion • Impacts on global air quality • Biodiversity and biospheric changes Scientific requirements to resolve uncertainty and develop meaningful policy • Require extensive use of large datasets from numerical models & many observational programs • Require extensive international coordination in the development and analysis of these datasets Climate change as our example National Center for Supercomputing Applications
Climate change is one of the biggest issues confronting humanity in the 21st century • Climate is the averaged trend of weather, or the typically expected conditions • Heat trapping gases emitted from human activities are driving significant changes in the climate • Climate change magnifies existing health, environmental and social problems National Center for Supercomputing Applications
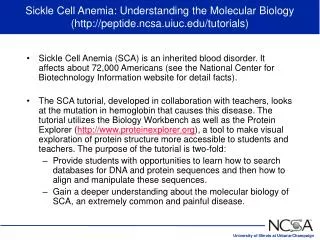
Evaluation of the Change in Annual Global Temperature Natural forcing only Human forcing only Temperature anomalies = change in temperature relative to 1880-1920 All forcings National Center for Supercomputing Applications
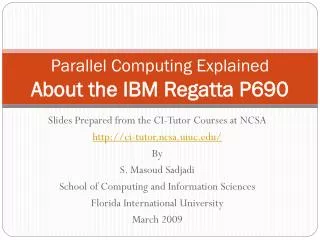
Projected Global Surface Temperature Response: ~ 1.5 to 5.8 °C by 2100 Relative to 1990 Ensemble of Climate Models Derived Change in Annual Temperature for 2071-2100 relative to 1961-1990 National Center for Supercomputing Applications
Concerns about Impacts of Climate Change are at the Local to Regional Level Also winds and severe weather events National Center for Supercomputing Applications
Assessing Regional Climate Effects • Impacts happen locally -- Regional analyses of climate change are essential to evaluating impacts • Outputs from the large scale climate model are not adequate • Global climate projections better understood than regional effects. • Global models have grids of roughly 200 km x 200 km or bigger • Need analyses to 10 to 30 km to capture local variations and impacts • A complete assessment of climate change on human, ecological, and other systems is complicated by other stresses on these systems – many of which are human-related • Multiple approaches and datasets need to be considered • Dynamical downscaling approaches are being developed • Regional scale models at the 10-50 km resolution or incorporation of nested grids at this resolution into global models National Center for Supercomputing Applications
Modeling Dataset User User NCAR Satellite Dataset Measurement dataset UIUC Russia China User User User Large datasets need to be shared to resolve global change issues This requires Gbps capacity National Center for Supercomputing Applications
Richard M. CrutcherProfessor of Astronomy, University of IllinoisandSenior Associate Director for Applications,National Center for Supercomputing Applicationsemail: crutcher@ncsa.uiuc.edu National Center for Supercomputing Applications