Download
1 / 1
10 likes | 113 Vues
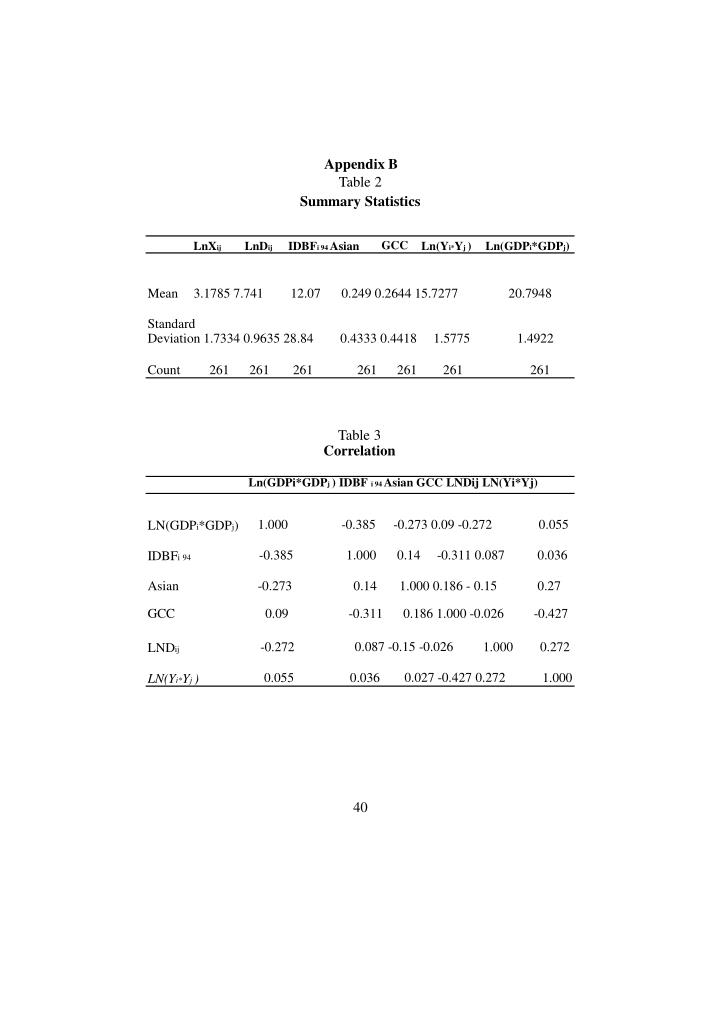
Appendix B Table 2 Summary Statistics. GCC. IDBF i 94 Asian. LnX ij. LnD ij. Ln(Y i* Y j ). Ln(GDP i *GDP j ). Mean. 3.1785 7.741. 12.07. 0.249 0.2644 15.7277. 20.7948. Standard. Deviation 1.7334 0.9635 28.84. 0.4333 0.4418. 1.5775. 1.4922. Count. 261. 261. 261. 261. 261.

E N D
Appendix B Table 2 Summary Statistics GCC IDBFi 94 Asian LnXij LnDij Ln(Yi*Yj ) Ln(GDPi*GDPj) Mean 3.1785 7.741 12.07 0.249 0.2644 15.7277 20.7948 Standard Deviation 1.7334 0.9635 28.84 0.4333 0.4418 1.5775 1.4922 Count 261 261 261 261 261 261 261 Table 3 Correlation Ln(GDPi*GDPj ) IDBF i 94 Asian GCC LNDij LN(Yi*Yj) 1.000 -0.385 -0.273 0.09 -0.272 0.055 LN(GDPi*GDPj) -0.385 1.000 0.14 -0.311 0.087 0.036 IDBFi 94 Asian GCC -0.273 0.09 0.14 -0.311 1.000 0.186 - 0.15 0.186 1.000 -0.026 0.27 -0.427 0.087 -0.15 -0.026 -0.272 1.000 0.272 LNDij 0.027 -0.427 0.272 0.055 0.036 1.000 LN(Yi*Yj ) 40