Download

1 / 16
160 likes | 264 Vues
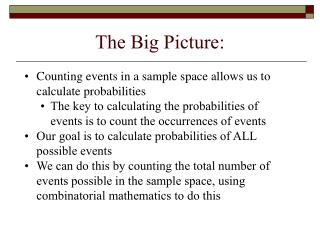
Part I THE BIG PICTURE. Sales Management Resources: Estimating Potentials and Forecasting Sales. Sales budget. Production budget. Revenue budget. Sales and administrative expense budget. Direct labor materials and overhead budgets. Cost of goods sold budget.

E N D
Part ITHE BIG PICTURE Sales Management Resources: Estimating Potentials and Forecasting Sales
Sales budget Production budget Revenue budget Sales and administrative expense budget Direct labor materials and overhead budgets Cost of goodssold budget Budgeted profitand loss statement IMPACT OF SALES FORECASTS ON BUDGETING Sales forecasts
Figure SMR2-1Relations Among Market Potential, Industry Sales, and Company Sales Market potential Industry forecast Basic Demand Gap Industry Sales Company potential Company forecast Company Demand Gap Actual Forecast 1 2 3 4 5 6 7 8 9 10 11 12 Custom time period
Table SMR2-1 Data Used to Calculate Buying Power Index
Table SMR2-2 Estimating the Market Potential for Food Machinery in North Carolina a The production employee data are from the 2002 Economic Census of Manufacturing, Geographic Area Series, North Carolina, p. NC1 & 2. The codes are the new NAIC codes b Estimated by manufacturer from past sales data.
Table SMR2-3Utilization of Sales Forecasting Methods of 134 Firms Percentage Percentage of of Firms Percentage of Firms that That Use Firms No Methods Use Regularly Occasionally Longer Used Subjective Sales force composite 44.8% 17.2% 13.4% Jury of executive opinion 37.3 22.4 8.2 Intention to buy survey 16.4 10.4 18.7 Extrapolation Naïve 30.6 20.1 9.0 Moving Average 20.9 10.4 15.7 Percent rate of change 19.4 13.4 14.2 Leading indicators 18.7 17.2 11.2 Unit rate of change 15.7 9.7 18.7 Exponential smoothing 11.2 11.9 19.4 Line extension 6.0 13.4 20.9 Quantitative Multiple regressing 12.7 9.0 20.9 Econometric 11.9 9.0 19.4 Simple regression 6.0 13.4 20.1 Box-Jenkins 3.7 5.2 26.9
Table SMR2-4 Calculating a Seasonal Index from Historical Sales Data a Seasonal index is 58.0/9.25 = 0.73
NAÏVE FORECASTS AND PERCENTAGE FORECASTING ERROR Quarter 1 2 3 4 Actual sales 49 77 90 79 Naïve forecast 49 77 90 Percentage forecasting error = forecast – actual actual Percentage forecasting error = 49-77 = 36% 77
Figure SMR2-2 Comparing Trend Forecasting Methods 50 40 Percent rate of change forecast Unit rate of change forecast Naïve forecast Moving average forecast 30 Sales 20 10 1 2 3 4 5 0 Time Period
CALCULATING A MOVING AVERAGE FORECAST where Ft+1 = forecast for the next period St = sales in the current period n = number of periods in the moving average
MOVING AVERAGE FORECASTING EXAMPLE Quarter 1 2 3 4 Actual sales 49 77 90 79 Two-period moving average 6383.5
CALCULATING AN EXPONENTIALSMOOTHING FORECAST where = smoothed sales forecast for period t and the forecast for period t + 1 α = the smoothing constant St = actual sales in period t -1 = smoothed forecast for period t – 1
EXPONENTIAL SMOOTHING FORECASTING EXAMPLE Quarter 1 2 3 4 Actual sales 49 77 90 79 Smoothed forecast 60.2 72.1
Figure SMR2-3 Fitting a Trend Regression to Seasonally Adjusted Sales Data 90 80 3.6 Sales 70 Y = 63.9 + 3.5 X 63.9 60 0 1 2 3 4 5 6 50 Time Period
FORECASTING WITH MOVING AVERAGES Time Periods 1 2 3 4 5 6 Actual sales 49 77 90 79 57 98 Seasonally adjusted sales 67 68 78 81 78 87 Two-period moving average forecast seasonally corrected 78.3 70.1 58.0 89.8 Three-period moving average forecast seasonally corrected 68.9 55.2 89.3 Two-period moving average forecast Three-period moving average forecast F3 = ( S1 + S2 ) x I3 F4 = ( S1 + S2 + S3 ) x I4 2 3 = ( 67 + 68 ) x 1.16 = ( 67 + 68 + 78 ) x 0.97 2 3 = 78.3 = 68.9