Download
1 / 16
160 likes | 172 Vues
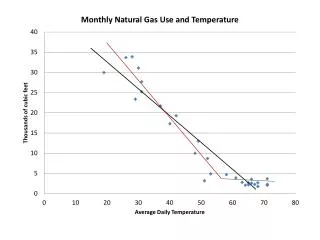
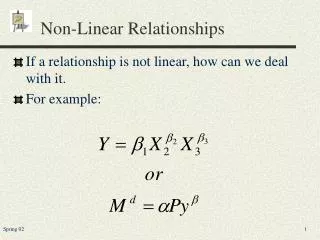
Non-linear relationships. What to do, when the relationship is not linear. Possibilities.

E N D
Non-linear relationships What to do, when the relationship is not linear
Possibilities • Transformation – can practically help just in monotonous relationships – one have to be careful – transformation of predictor changes just shape, transformation of response changes also the probability characteristics (distribution of residuals)
Possibilities • Polynomial regression – any function can be replaced (in limited range of predictor values) by polynomial function, • i.e. b0 + b1x+ b2x2 + b3x3... • Assumption, residuals are normal, homogeneously distributed, i.e • Y = b0 + b1x+ b2x2 + b3x3…+ε • Traditional names quadratic regression, cubic regression
Polynomial regression Actually, it is application of multiple linear regression, where predictors are X, X2, X3 etc. Computation is the same (i.e. again criteria of least sum of residual squares, which again has (in normal conditions) one minimum). Similar meaning has also R2, similar computation of significance tests (i.e. total ANOVA of model, and tests for single terms of polynomial). So, I assume again, that ε is additive, independent of predicted value (homogeneity of variance).
1 2 With degree of polynomial increases “flexibility” Time, in hours Time, in hours Weight, in kilograms Weight, in kilograms 3 4 Time, in hours Time, in hours Weight, in kilograms Weight, in kilograms 5 Attention! Increasing complexity does not always mean better prediction ability. Time, in hours Weight, in kilograms
Stepwise regression – it makes model more complex gradually -quadratic regression can be highly significant even if linear regression is not Significance of quadratic term can be understood as prove of relation non-linearity
We usually use polynomial regression, when • we see the relation isn’t linear, but we haven’t any idea, what shape does the function have • I do not remember seeing wise use of higher than third order polynomial.
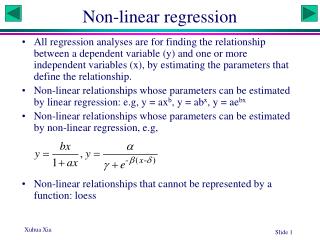
Other possibilities • I have idea (e.g. from some theory), how should dependence looks like and I believe the residuals will be randomly spread around value predicted, i.e. model is • Y=f(X) + ε [X here is vector, so, it can be more then one independent variable] • We estimate again using method of least sum of squares
In contrast to methods of linear regression (including polynomial one) it is necessary to find minimum using methods of numerical mathematics – there haven’t to exist analytical solution, nor there is any certainty, that minimum found is global one. Numerical progress: 1. Derivate according to all parameters estimated. 2. Take all the derivations as equal to zero. 3. Solve the system. Numerical solution of formula f(x)=0
In contrast to methods of linear regression (including polynomial one) it is necessary to find minimum using methods of numerical mathematics – there haven’t to exist analytical solution, nor there is any certainty, that minimum found is global one. Numerical progress: 1. Derivate according to all parameters estimated. 2. Take all the derivations as equal to zero. 3. Resolve the system. Numerical solution of formula f(x)=0 [Newton method] f(x) x1 x2 x3 x “My” estimation of x
Disadvantages of numericalsolution • It doesn’t always converge • It sometimes finds just local minimum (derivations are equal to zero even there), and we haven’t many possibilities how to prove, which minimum it is. • We need initial values of parameters.
Various “local regressions” – I won't get function, it is different for various local parts of the line
I know distribution of response variable • Generalized Linear Models • They are able to reflect distribution type - so, even which values can the response have (e.g. probability of survival must be between zero and one) • Link function