Download
1 / 28
280 likes | 372 Vues
Benchmarking Business Performance Best Practice Examples. Omar L. Hassouneh M.Sc. Environmental Engg. Future Environment. Objectives. What is Environmental Benchmarking? Why is it Important? Why to Enhance your Environmental Business Performance?

E N D
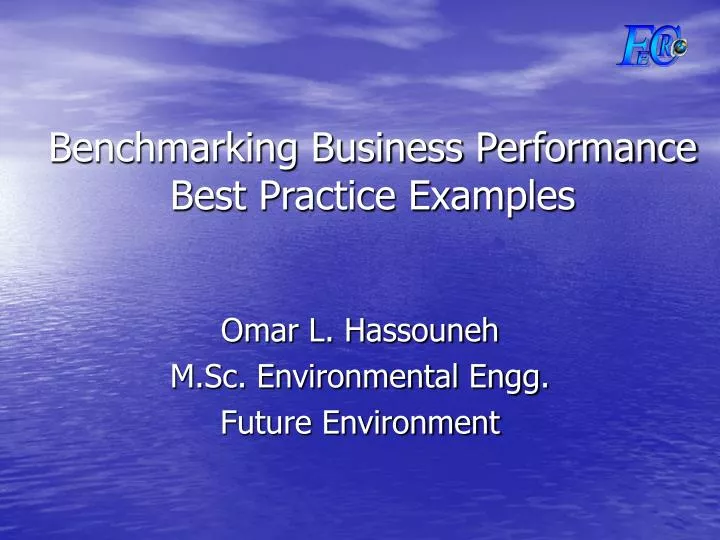
Benchmarking Business Performance Best Practice Examples Omar L. Hassouneh M.Sc. Environmental Engg. Future Environment
Objectives • What is Environmental Benchmarking? Why is it Important? • Why to Enhance your Environmental Business Performance? • What is an Environmental Performance Indicator? • How to Benchmark your Environmental Business Performance? • Does it Worth the Effort?
Where does Jordan Stand? Environment-Related Indices - Prescott-Allen’s Wellbeing Index - Consultative Group on Sustainable Development Indicators (CGSDI) - Redefining Progress Institute (the Ecological Footprint index) - GLTETF/World Economic Forum, Environmental Sustainability Index (ESI)
ESI-2002 Sixty Eight (68) parameters within Five (5) components: • Environmental Systems; • Environmental Stresses; • Human Vulnerability; • Social and Institutional Capacity; and • Global Stewardship
Finland (1st) ESI 73.9 Jordan (53rd) ESI 51.7 Total 142 Countries http://www.ciesin.columbia.edu/indicators/ESI
Key Common Parameters • Significant Positive Correlation with GDP • Innovative Responses Development • Private Sector Responsiveness
Environment-Related Regulations Examples • Law of Protection of the Environment, Law No. 12, 1995; • Clear Air By Law (Under Development) • Solid Waste Management By Law (U.D.) • Water Protection By Law (U.D.) • Greenhouse Emissions By Law (U.D.) • Regulation for the Limitation of and Precaution from Noise
Environment-Related Standards Examples • Pollutants Ambient Air Quality Standard JS 1140/1996 • Reclaimed Domestic Waste Water JS 893/2002 • Industrial Wastewater JS 202/2003 (Under Revision) • Pollutants Maximum Allowable Limits of Air Pollutants Emitted from the Stationary Sources JS 1189/1991
How to Measure your Environmental Performance? • Analyze your Process • Determine points of pollutants generation • Determine Environmental Performance Indicators • Define normalization factors (relate to production size) • Determine Pollution Contribution for each of the Processes • Find Best Available Technology (BAT) values for EPIs • Monitor Performance and Analyze Results • Compare to Competitors Performance • Continually Improve your Performance
SMART Compare to Competitors (Benchmark) Set Targets Monitor and Evaluate Performance Implement Process Analysis “Determine EPI’s”
General Tips and Techniques • Water Conservation • Proper production management procedures • Reuse rinsing and cooling water • Use separate streams for chemicals flow (GHK) • Water Characterization • Avoid using chemicals wherever possible • Use biodegradable chemicals • Accurately adjust chemicals dosing system
Tips and Techniques (Cont.) • Energy Conservation • Segregate cold and hot water streams for heat recovery • Insulate pipes and machinery to minimize heat losses • Monitor machines performance • Optimize tasks scheduling to minimize energy consumption • Consider the use of devices of low energy ration
Tips and Techniques (Cont.) • Solid Waste Minimization • Consult your vendor for using biodegradable and/or less volume packaging material • Minimize the use of disposable materials/containers • Segregate hazardous solid waste by special containers • Separate different types of domestic solid waste
Case 1: Chemicals Industry • Large amounts of particulates emission. Exceeding the thresholds of JS 1140/1996.
Problem Analysis • Company’s Capital Investment: JDM1.5 • Problem: Large amounts of particulates emission. Exceeding standards thresholds of air emissions (JS 1140/1996). • Investigation: Measure particulates (PM10) concentration in different units to determine contribution of each unit. • Result: Powder detergent filling unit produces 45% of total particulates emissions.
Solution • Isolate Powder Filling Unit and install bag filters at unit ventilation points. • Install vacuum feeding machine to feed the filling machine directly from the mixer. • Contact vendor to provide raw material in barrels instead of bags. • Set a preventive maintenance program to ensure filling machine efficiency.
Results • A total investment of US$70,000 was required to install air filtration system. • Actual investment of US$8,000. • Reduced particulates emissions by 70%. • Improved the powder detergents unit performance by 5% (wasted raw material)
Case 2: Gas Industry-Energy Conservation • A monthly electricity bill that exceeds JD10,000 (20% of the plant operating cost).
Problem Analysis • Company’s Capital Investment: JDM 0.5 • Year of establishment: 1976 • Problem: High electrical energy consumption (≈JD10,000) forming 20% of the plant operating expenses. • Investigation: • Review the design of the available equipment to ensure no over-sizing. • Deliver an energy audit to measure the power performance of available equipment. • Determine the high electricity consuming equipment/facilities and propose modifications.
Findings and Solutions • Air compressors and refrigeration system are the major energy consuming facilities. • Monitored the performance of these equipment and determined their power factors. • Set procedures for the operation of the equipment away from the Maximum Demand Period (reduced penalties). • Used low power ration equipment. • Set a system for plant GHK and internal management.
Results • Minor investment required (≈JD6,000) • First three months bill: JD6,800-JD7,900 (no major change to plant productivity)
Economic Value-Example “Best Management Practices for Pollution Prevention in the Textile Industry” EPA, 1996.
Economic Value-Example (Cont.) Fabric Flow Raw Water Water Flow Estimated Investment: US$50,000 Annual Estimated Savings: US$95,000/yr (Production dependent)