Download
1 / 33
330 likes | 457 Vues
Ethanol, Grain Marketing, and Risk Management. 25 th Annual Tri-State Agricultural Lender’s Seminar Dubuque, Iowa Oct. 26, 2011 Chad Hart Assistant Professor/Grain Markets Specialist chart@iastate.edu 515-294-9911. Oil Prices. Source: EIA for history, NYMEX for future. Population.

E N D
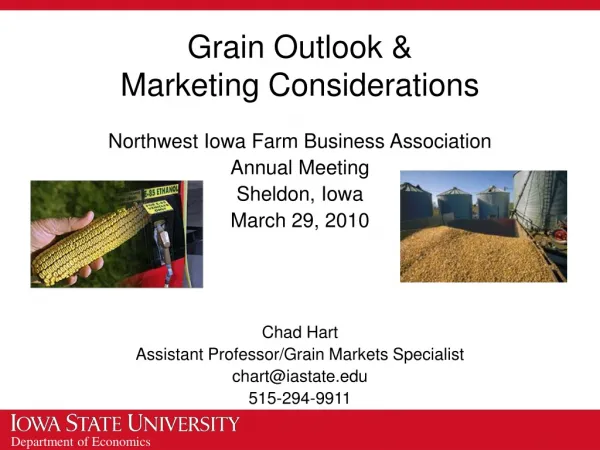
Ethanol, Grain Marketing, and Risk Management 25th Annual Tri-State Agricultural Lender’s Seminar Dubuque, Iowa Oct. 26, 2011 Chad Hart Assistant Professor/Grain Markets Specialist chart@iastate.edu 515-294-9911
Oil Prices Source: EIA for history, NYMEX for future
Population Source: U.S. Bureau of the Census, International Data Base
Liquid Fuel Usage Source: Energy Information Administration
Ethanol Production Source: EIA, 2011 Projection by Hart
Corn Grind for Ethanol Source: DOE-EIA
Ethanol Margins Source: CARD
Ethanol Margins Source: CARD
Gasoline Consumption Source: EIA, Annual Energy Outlook
U.S. Corn Supply and Use Source: USDA-WAOB
U.S. Soybean Supply and Use Source: USDA-WAOB
Projected Corn Yields Source: USDA-NASS
Projected Soybean Yields Source: USDA-NASS
World Corn Production Source: USDA-WAOB
World Soybean Production Source: USDA-WAOB
Corn vs. Wheat Source: CME Group, 10/25/2011
Hog Crush Margin The Crush Margin is the return after the pig, corn and soybean meal costs. Carcass weight: 200 pounds Pig price: 50% of 5 mth out lean hog futures Corn: 10 bushels per pig Soybean meal: 150 pounds per pig Source: Shane Ellis, ISU Extension
Corn Export Sales Source: USDA-FAS
Corn Export Shifts Source: USDA-FAS
Soybean Export Sales Source: USDA-FAS
Soy Export Shifts Source: USDA-FAS
Thoughts for 2012 and Beyond • General economic conditions • Continued worldwide economic recovery is a major key for crop prices • US job recovery, European financial concerns, Chinese inflation • Supply/demand concerns • Smaller than anticipated U.S. crops • Biofuel growth and energy demand • Corn still has the upper hand in the acreage competition • Will supply be able to keep pace with demand? • 2011/12: USDA: Corn $6.70; Soy $13.15 • Futures (as of 10/25/11): Corn $6.32; Soy $11.97 • 2012/13: Futures (as of 10/25/11): Corn $5.90; Soy $11.92
Thank you for your time!Any questions?My web site:http://www.econ.iastate.edu/~chart/Iowa Farm Outlook:http://www.econ.iastate.edu/ifo/Ag Decision Maker:http://www.extension.iastate.edu/agdm/