Download
1 / 58
580 likes | 694 Vues
Welcome to the Child Outcomes Data Workshop!. Child Outcomes Data Workshop. Pre-Meeting Workshop at the OSEP National Early Childhood Conference Washington, DC December 2007. SRI International Kathy Hebbeler Donna Spiker The State of Connecticut Alice Ridgway The State of Minnesota

E N D
Welcome to the Child Outcomes Data Workshop!
Child Outcomes Data Workshop Pre-Meeting Workshop at the OSEP National Early Childhood Conference Washington, DC December 2007 Early Childhood Outcomes Center
SRI International Kathy Hebbeler Donna Spiker The State of Connecticut Alice Ridgway The State of Minnesota Lisa Backer Frank Porter Graham Child Development Institute Lynne Kahn Robin Rooney Christina Kasprzak Courtney Valdes Today’s Cast: Early Childhood Outcomes Center
Objectives Participants will begin to understand: • How to examine the validity of state child outcomes data • How to interpret and use valid data • How to talk about early and future data with the media Early Childhood Outcomes Center
The Layout of the Day • Morning: Early Data • Are the data valid? • What can we say to the media (and how do we say it) about less than ideal data? • Lunch On Your Own (12:30 – 2:00) • During which all data become valid. Remember what you ate… • Afternoon: Using Quality Data • What can we learn from outcomes data? Early Childhood Outcomes Center
Keeping our eye on the prize: High quality services for children and families that will lead to good outcomes. Early Childhood Outcomes Center
High Quality Data on Outcomes • Data are a piece of a system that helps to achieve overarching goals for children and families • Data yield • Findings that can be interpreted as having a particular meaning that leads to specific actions to improve the system. Early Childhood Outcomes Center
System for Producing Good Child and Family Outcomes Adequate funding Good outcomes for children and families High quality services and supports for children 0-5 and their families Good Federal policies and programs Good State policies and programs Good Local policies and programs Strong Leadership • Prof’l Development • Preservice • Inservice Early Childhood Outcomes Center
The Vision: Using Data as a Tool for Program Improvement • State will have quality data available on an ongoing basis about multiple components of the system • Child and family outcomes • Services provided • Personnel (types, qualifications, etc.) • Etc. Early Childhood Outcomes Center
FMA Findings Meanings Action Early Childhood Outcomes Center
Findings • Findings are the numbers • 10% of families responded …… • 45% of children were in OSEP category b • The numbers are not debatable (assuming the numbers are correct…) Early Childhood Outcomes Center
Meaning • The interpretation put on the numbers • Is this finding • Credible? (Based on valid data?) • Good news? • Bad news? • News we can’t interpret? Early Childhood Outcomes Center
Meaning • Meaning is debatable. Reasonable people can reach different conclusions from the same set of numbers • Stakeholder involvement can be helpful in making sense of findings • To interpret meaning, sometimes we analyze data in other ways (ask for more findings) Early Childhood Outcomes Center
Putting Meaning on the Data • What are alternative explanations for the finding? • Are there other ways of looking at the data that might provide insight into a possible explanation? (i.e., should we run more analyses?) Early Childhood Outcomes Center
Action • Given the meaning put on the findings, what should be done? • Possible actions: • Continue quality assurance activities to improve the quality of the data • Accept the data as credible and develop recommendations based on the findings • Action is always debatable – and often is debated • Another role for stakeholders Early Childhood Outcomes Center
Building quality into the state system • Keep errors from occurring in the first place • Develop mechanisms to identify weaknesses that are leading to data collection errors • Provide ongoing feedback including reports of the data to programs and providers Early Childhood Outcomes Center
Procedures to Promote Quality • Preparing for data collection • Adequate training and communication • During data collection • Commitment to the data collection • System of supports for the “data providers” • After data collection • Data entry • Data follow up • Data analysis Early Childhood Outcomes Center
Quality of the process: Preparing for data collection Training and Communication • Is there a process for checking whether all of the [data] providers understand what they are to do? • Is there a process for checking whether they do it? • Do they know why they are doing it? **What do we know about one shot trainings??** Early Childhood Outcomes Center
Quality of the Process:During Data Collection Commitment to the data collection • Do providers understand the importance of the activity? • Has the system been designed so providers (and families) will receive benefit from collecting and providing data? • Do providers know someone will be checking on what they are doing? Supports • Has the process been designed to make it as easy and to take as little time as possible? (Can any part be streamlined?) • Is a knowledgeable person observing or tracking data collection activities and providing feedback in a timely manner? • Is there a way for providers to get ongoing questions addressed? Early Childhood Outcomes Center
Quality of the Process: After Data Collection Data entry • Are there safeguards to minimize data entry errors? Data follow up • Verification: Is there a process in place for checking [a sample of] records for accuracy and completeness? • Is there a process for providing timely feedback when errors are discovered? Early Childhood Outcomes Center
Quality of the Process: After Data Collection Data analysis • Cleaning individual data: Are there procedures for identifying out of range values, anomalies, incomplete data? • Is there a plan for looking at the aggregated data in various ways to identify unexplainable variations, strange patterns, etc.? • Is there a process for providing timely feedback when errors are discovered? Early Childhood Outcomes Center
Validity • Validity refers to the use of the information • Does evidence and theory support the interpretation of the data for the proposed use? Or • Are you justified in reaching the conclusion you are reaching based on the data? Standards for Educational and Psychological Testing (1999) by American Educational Research Association, American Psychological Association, National Council on Measurement in Education Early Childhood Outcomes Center
Validity Argument • Accumulation of evidence from a series of “if-then” propositions about the data • If the data are valid, then……, e.g., • Data should not vary wildly across programs serving the same kinds of children • Data for children with certain kinds of disabilities should look different than data for other children • Etc. • Are there sensible patterns in the data? Early Childhood Outcomes Center
In Search of Validity Early Childhood Outcomes Center
Take Home Message If you conclude the data are not (yet) valid, they cannot be used for program effectiveness, program improvement or anything else. Meaning = Data not yet valid Action = Continue to improve data collection and quality assurance Early Childhood Outcomes Center
The validity of your data is questionable if: ? Early Childhood Outcomes Center
The validity of your data is questionable if: • The n is too small. If your n is small, make sure all of your tables and text show the n prominently. Early Childhood Outcomes Center
The validity of your data is questionable if: • The n is too small. • The overall pattern in the data looks “strange.” Strange = Unexplainable Variation But how do you know? Compared to what? Early Childhood Outcomes Center
The validity of your data is questionable if: • The n is too small. • The overall pattern in the data looks “strange.” • Compared to what you would expect. Early Childhood Outcomes Center
The validity of your data is questionable if: • The n is too small. • The overall pattern in the data looks “strange.” • Compared to what you would expect. • Compared to other data you have available. Early Childhood Outcomes Center
What else do you know (or can find out?) • Child outcomes: • D + E = 73% of children exiting meeting age expectations (reasonable?) • Part C 618 Exit Data: • Do the exit data support this? Early Childhood Outcomes Center
The validity of your data is questionable if: • The n is too small. • The overall pattern in the data looks “strange.” • Compared to what you would expect. • Compared to other data you have available. • Compared to other states (that you would expect to be similar). Early Childhood Outcomes Center
State Data Sharing (AKA Looking for Red Flags) Early Childhood Outcomes Center
Validity and Generalizability • Which group do these findings apply to? • Is the group with data representative of children served in the program statewide? • By geography • By demographics • By types of disabilities and delays • By length of time in service Early Childhood Outcomes Center
Non-representative data If data does not include: • All areas of state • Dallas ≠ Texas • All kinds of families in state • No minority families • All kinds of children served in program • Only children with severe disabilities Early Childhood Outcomes Center
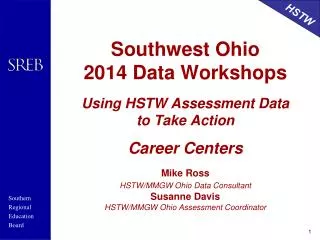
Non-representative data If data does not include: • Children who have been in program the maximum length of time, .e.g., 36 months for Part C. • All states have non-representative child outcomes data in 2008 (and 2009…). Early Childhood Outcomes Center
Percentage of Infants & Toddlers Entering Services by Age at Entry * * Age at development of the Individualized Family Service Plan (IFSP).
Non-representative data If data does not include: • Children who have been in program the maximum length of time, .e.g., 36 months for Part C. • This applies to every state’s data. • Complete the “Earliest possible date….” worksheet. Early Childhood Outcomes Center
Implications of non-representative data • The findings may be valid BUT only for the group represented in the data • The findings are not valid for your state overall. Validity is related to use of the data. Early Childhood Outcomes Center
The validity of your data is questionable if: • The n is too small. • The overall pattern in the data looks “strange.” • The data are not representative of the state and the conclusions being drawn suggest they are. Early Childhood Outcomes Center