Download

1 / 13
140 likes | 308 Vues
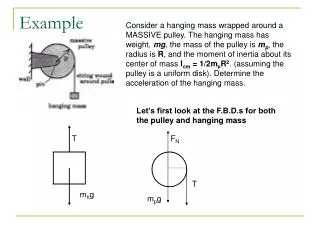
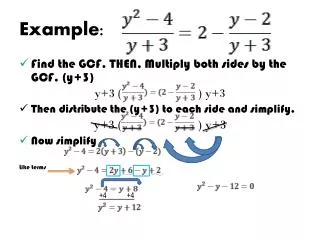
EXAMPLE. Example 11.1. A feed to a column has the composition given in the table below, and is at a pressure of 14 bar and a temperature of 60 o C. Calculate the flow and composition of the liquid and vapour phases. Take the equilibrium data . Solution.

E N D
Example 11.1 A feed to a column has the composition given in the table below, and is at a pressure of 14 bar and a temperature of 60oC. Calculate the flow and composition of the liquid and vapour phases. Take the equilibrium data Solution For two phases to exist the flash temperature must lie between the bubble point and dew point of the mixture
Check feed condition therefore the feed is a two phase mixture
Hengstebeck’s method is used to find the third trial value for L/V. The calculated values are plotted against the assumed values and the intercept with a line at 45o (calculated = assumed) gives the new trial value, 2.4.
Example 11.2 Acetone is to be recovered from an aqueous waste stream by continuous distillation. The feed will contain 10 per cent w/w acetone. Acetone of at least 98 per cent purity is wanted, and the aqueous effluent must not contain more than 50 ppm acetone. The feed will be at 20oC. Estimate the number of ideal stages required.
The equilibrium curve can be drawn with sufficient accuracy to determine the stages above the feed by plotting the concentrations at increments of 0.1.
Sensible heat Latent heat for the operating line at minimum reflux = 0.65
three stages above the feed up to y = 0.8. • the stages above y = 0.8: three to four stages required; • total stages above the feed 7
Below the feed, one stage is required down to x = 0.04 • A log-log plot is used to determine the stages below this concentration. • Data for log-log plot: 5