Download

1 / 21
210 likes | 367 Vues
The Effect of SCHIP Expansions on Health Insurance Decisions by Employers. Thomas Buchmueller (UC Irvine and NBER) Phil Cooper (AHRQ) Kosali Simon (Cornell University and NBER) and Jessica Vistnes (AHRQ). SCHIP Expansions. In 2002, SCHIP covered 5 million children

E N D
The Effect of SCHIP Expansions on Health Insurance Decisions by Employers Thomas Buchmueller (UC Irvine and NBER) Phil Cooper (AHRQ) Kosali Simon (Cornell University and NBER) and Jessica Vistnes (AHRQ)
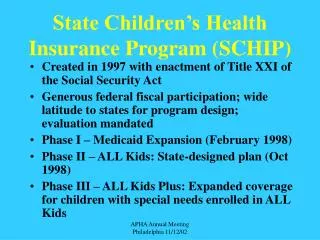
SCHIP Expansions • In 2002, SCHIP covered 5 million children • (Almost) all children in families under 200% of the Federal Poverty Level are now eligible • Compared to earlier federal minimums of 185% for infants, 133% for children 1-6, 100% for children born after 1983 • 32 states changed eligibility for older children (17-18) from <100% to at least 200% FPL • Expansions occurred late 1998/early 1999 • Variation in the timing and extent of SCHIP adoption across states
Did SCHIP affect employers’ health insurance decisions? • Did employers cut back on offers of health insurance in low and middle wage firms as a result of SCHIP? • Did employers encourage workers to drop family benefits? • By increasing employee contributions to family health insurance plans? • Did workers drop family benefits?
Anecdotal Evidence • RWJ outreach programs • Evidence from state benefit managers • Roll-backs
Hypotheses • Reasons to expect an effect • Family health insurance premiums were $7500 in 2001, with employees contributing $1740 of the cost • In 1996 , many children who would later become eligible for SCHIP were covered by private insurance and had working parents • Administrative data show several million children served by SCHIP
Hypotheses • Reasons to expect no effect • SCHIP has measures designed to prevent crowd out • Competitive labor markets of the late 1990s, even for low-wage employers • Take-up of SCHIP has been low, stigma costs may exist • Employers might not know employees’ total family income and employee eligibility for SCHIP
Importance of using employer data to answer these questions • Employer decisions plausibly driven by the median worker, and individual level data do not identify employer workforce characteristics • Problems in identifying ‘affected’ group in individual data • Employer decisions such as premium contributions are not captured well in individual level surveys
Findings from previous studies • Household-based studies • Cutler and Gruber (1996) • Dubay and Kenney (1997) • Shore-Sheppard (1997) • Yazici and Kaestner (1998) • Thorpe and Florence (1998/1999) • Blumberg, Dubay and Norton (1999) • Cunningham, Hadley, Reschovsky(2002) • LoSasso and Buchmueller (forthcomming) • Employer-based studies • Shore-Sheppard, Buchmueller and Jensen (2000)
Methods • Dependent variables: employer and employee level health insurance decisions and outcomes • offer insurance • offer family coverage • cost of family • Also, cost relative to single coverage • Enrollment rate • Family enrollment rate • ‘Affected’ firms: those with substantial share of workers newly eligible for SCHIP (other firms serve as controls)
Econometric Specification • Identifying sources of variation: • Exploiting time and state variation in eligibility expansions Model: Y = B1 * Eligibility+ B2 * Percent LOW + B3 * (Percent Low * Eligibility) +B5 * Other Characteristics • Where Y = different health insurance outcomes
Data • MEPS-Insurance Component (MEPS-IC) • List Sample of Private Establishments • 1997-2001 • Roughly 25,000 private sector establishments and their plans in each year • Employers asked: • Whether they offer insurance • Fraction of eligible active workers that enroll • At all • In single/non-single coverage • Premiums and contributions for single and family coverage • Workforce characteristics, including information on the percent of workers in three different wage ranges
Data (continued) • Wages: 1997-1999 <$6.50, $6.50-$15.00, >$15 • Wages: 2000-2001 <$9.50, $9.50-$21.00, >$21 • Industry • Age of firm • Establishment size • Percent of workforce that are women, union members, over age 50, part time • For profit status • Organization type (i.e. corporation) • State dummies • Year dummies
Data (continued) • We merge in data on: • SCHIP/Medicaid Eligibility • Computed from running detailed simulation programs (created by Gruber and Simon) on March CPS respondents as in Cutler and Gruber (1996) • We take all March CPS children in 1996, and calculate the weighted fraction of them that would be eligible for Medicaid or SCHIP in a particular state in a particular year. That fraction is used as our measure of Medicaid/SCHIP generosity. The measure varies by state and year.
Data (continued) • Workers most likely to affected by SCHIP expansions. • Using PUMS we construct a proxy measure of the percent of families with children under 200 % FPL by industry and state (LOW).
Data (continued) • Other data merged onto the MEPS-IC: • Area Resource File • Unemployment rate • Per capita income • Number of active doctors in area • Number of HMOs in county • County Business Pattern Data • Percent of establishments with < 10 employees, > 1000 employees, in manufacturing • Herfindahl index
Results • Offers and Family Offers • No significant results on eligibility in either equation • Employers are not reacting to SCHIP through offers of coverage or family coverage
Results • Take-up • For hypothetical establishments with 50 percent of the workforce under 200 percent of the poverty line, a 0.188 increase in ELIG results in a: • 4 percentage point decrease in overall take-up rates. • 5 percentage point decrease in family take-up.
Results • Marginal Cost of Family Coverage (family – single). • For hypothetical establishments with 50 percent of the workforce under 200 percent of the poverty line, a 0.188 increase in ELIG results in a: • $378 increase in the marginal cost of family coverage • All workers under 200 FPL - $800 increase in marginal cost of family coverage
Implications • If employers are reacting to SCHIP expansions, what will happen with rollbacks? • What is the effect of a sluggish economy?
Future plans • Include other measures of SCHIP: outreach, waiting periods, paperwork simplification • Use more worker eligibility indices (<100 FPL, 200 – 300 FPL, etc.) • Additional years