Download
1 / 18
180 likes | 287 Vues
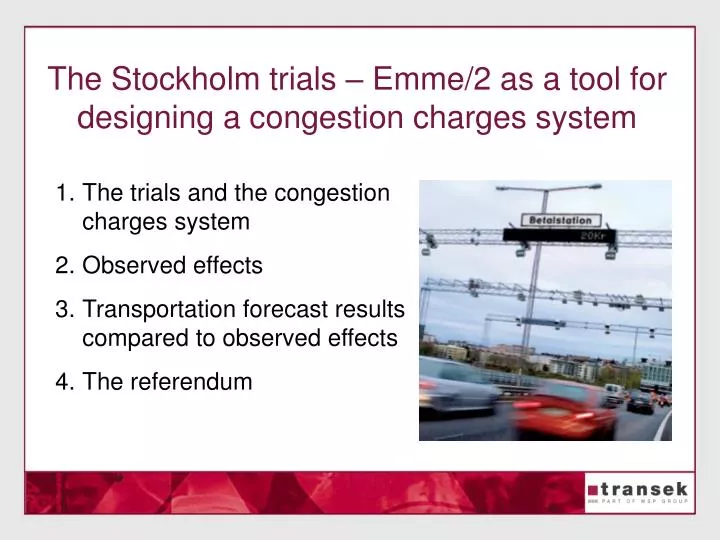
The Stockholm trials – Emme/2 as a tool for designing a congestion charges system. The trials and the congestion charges system Observed effects Transportation forecast results compared to observed effects The referendum. The Stockholm trials. More park-and-ride facilities.

E N D
The Stockholm trials – Emme/2 as a tool for designing a congestion charges system • The trials and the congestion charges system • Observed effects • Transportation forecast results compared to observed effects • The referendum
The Stockholm trials More park-and-ride facilities Implementation of a congestion tax Extended public transport
Objectives • Reduce traffic volumes on the busiest roads during peak hours by 10-15% • Improve the flow of traffic on streets and roads • Reduce emissions of pollutants harmful to human health and of carbon dioxide • Improve the urban environment as perceived by Stockholm residents
The congestion charges system ”Weekdays 6:30 am – 6:30 pm” • SEK 10, 15 or 20 for passage into and out of the inner city • No charges on evenings, nights, saturdays, sundays public holidays and the day before a public holiday • Maximum charge of SEK 60 per day and vehicle 10 SEK = 1,06 Euro, = 1,33 USD
Percentage change in traffic flows in and out of the congestion charge zone during the charge period (6.30 am – 6.30 pm)
No charge 10 SEK (1,06 Euro, 1,33 USD) 15 SEK 20 SEK Number of vehicles per hour Time Traffic passing in and out of the inner city on an average day in spring 2005 compared with spring 2006
Increase Unchanged Reduction Big reduction Difference in journey time along various monitoring routes, 2005-2006
Transportation forecasts – the purpose To supply: • basic data for decision about the design of the congestion charges system • basic data as input to other actors planning activities because of the Stockholm trial (for example Stockholm Transport (SL))
Transportation forecasts – analyzed scenarios • Different price structures • Different number of charging zones • With and without congestion charges on Essingeleden • With and without congestion charges for residents in Lidingö
Transportation forecasts – the forecast model Sampers: • Trip frequency • Mode split (car, public transport, walk, cykle) • Destination choice Emme/2: • Auto assignment (auto volumes on road network) • Transit assignment (passenger volumes on transit lines)
Transportation forecasts – model features • Traffic during the average weekday • Traffic during peak period and between peak periods • Different time values for different categories of people • Choice of departure time
Percentage change in traffic flows in and out of the congestion charge zone during the charge period Observed effect = -22 % Transportation forecast = -25 %
Number of vehicles per 15 minutes Without charges With charges Time Forecasted number of vehicles passingin and out of the inner city on an average day
Observed number of vehicles passingin and out of the inner city on an average day Autumn 2005 January 2006 February 2006 Number of vehicles per 15 minutes Time
Number of vehicles on different parts on E4-Essingeleden during the charge period (6.30 am – 6.30 pm) Observed increase = 4-5 % Forecast = +7 % 2006 2005 Essingeleden Frösunda Numver of vehicles Midsommar-kransen Month
What’s the results? • Percentage differences in traffic flows during an average weekday were forecasted with relative good results • The increase of traffic flow on Essingeleden were slightly overestimated • The decrease of traffic flow across the zone boundary were slightly overestimated • Incorrect distribution of the effects on morning peak period, between peaks and afternoon peak period • The forecasts missed the decrease in evening traffic • The effects of time departure choices were overestimated • Underestimated time values and underestimated travel time effects => more people opted to travel through the city than expected • Shortages in the model of time distribution functions and neglecting “turn and return thinking” => the real effects were bigger during afternoon peak period and between peaks and smaller during morning peak period
No referendum Referendum The referendum