Download
1 / 44
470 likes | 733 Vues
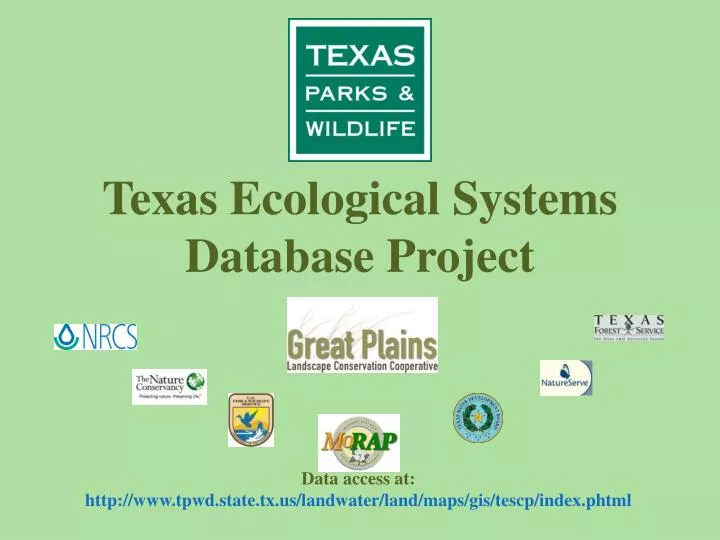
Texas Ecological Systems Database Project. Data access at: http://www.tpwd.state.tx.us/landwater/land/maps/gis/tescp/index.phtml. Project Goals. Increase resolution of landcover mapping for Texas Use field data to validate project

E N D
Texas Ecological Systems Database Project Data access at: http://www.tpwd.state.tx.us/landwater/land/maps/gis/tescp/index.phtml
Project Goals • Increase resolution of landcover mapping for Texas • Use field data to validate project • Integrate High Plains mapping with Texas Ecological Mapping Systems Data
Phase 6 September 2013 Texas Ecological Mapping Systems Database Project Phase 1 Available Now Phase LPC February 2012 Phase 2 Available Now Phase 5 September 2012 Phase 3 Available Now Phase 4 September 2011
Products/Enduring Value • Potential natural vegetation • Existing vegetation using an improved classification • Improved Ecological Systems interpretations for High Plains • Abiotic Site Type Data • Ground truth dataset (1,000+ Points in High Plains / 10,000+ Points Statewide) • User will build their own added value: • Context (local, regional, statewide) • Management options • Conservation opportunity areas • Ecological significance and risk (riverine/aquatics as well) • Species habitat modeling • Development of educational and interpretive materials • Change detection
Field Data Collected includes: • Top 3 dominant species in Tree, Shrub, Herbaceous and Succulent Strata • Percent Woody and Herbaceous Cover • Includes % Live Oak, Shrub, Tree, other Evergreen • Landcover and Mapping System • Reference photo
Environmental data (slope, aspect, elevation, solar insolation) Training data from air photos plus ground data 3-date TM Satellite Imagery (30m resolution) Land use data (NRCS Common Land Units) Classify Land Cover (e.g. cold deciduous forest) Draft Mapping Targets (NatureServe Ecological Systems) Assign Information using soils, ecoregions, geology, ecological site type, hydrology (“modeling”) Create Map with Named Mapping Units (e.g. West Gulf Coastal Plain Bottomland Seasonally Flooded Forest) Provide Interpretation of Mapping Units (booklet, summary statistics by ecoregion, etc.) Design and Execute Presentation
Modeling Inputs • National Agricultural Imagery Program 2010 Ortho-imagery • TPWD Generated Image Objects • Multi-date Landsat TM5 Imagery • TPWD Developed Landcover Data (12 Classes) • 1:24k National Hydrologic Data • National Elevation Dataset 10m DEMs • Playa Lakes Joint Venture Probable Playa Layer • TPWD Updated Common Land Unit Data • TPWD Modified Natural Resource Conservation Service SSURGO Data
SSURGO Soils: • Extensive clean-up of soils • Edge match ESD across county boundaries • Make sure ESD spatial distribution makes sense
SSURGO Soils Ecological Site Descriptions • Before TPWD modification
Landcover Classes Barren Agriculture Deciduous Woodland and Forest Deciduous Shrub Coniferous Evergreen Shrub High Intensity Urban Low Intensity Urban Marsh Mixed Woodland and Forest Open Water Dense Deciduous Shrub Grassland
Modeling Existing Vegetation Type Using Ecological Site Types (Ecoclasses) and Landcover
Evolving and Improving Implementation • Initially implemented in raster. Time consuming and prone to error introduction. • Moved to vector, working with attributed polygons. • Initial models used Excel. Moved to Access to reduce error introduction through transcription. • Initial vector models used Model Builder. Moved to python to make implementation more transparent and reproducible. • Improvements result in ability to rapidly iterate changes in model to visualization in map. Modeling issues can be quickly visualized and corrected.
Texas Ecological Mapping Systems Database Status April 2011 Data access at: http://www.tpwd.state.tx.us/landwater/land/maps/gis/tescp/index.phtml