Download
1 / 15
150 likes | 266 Vues
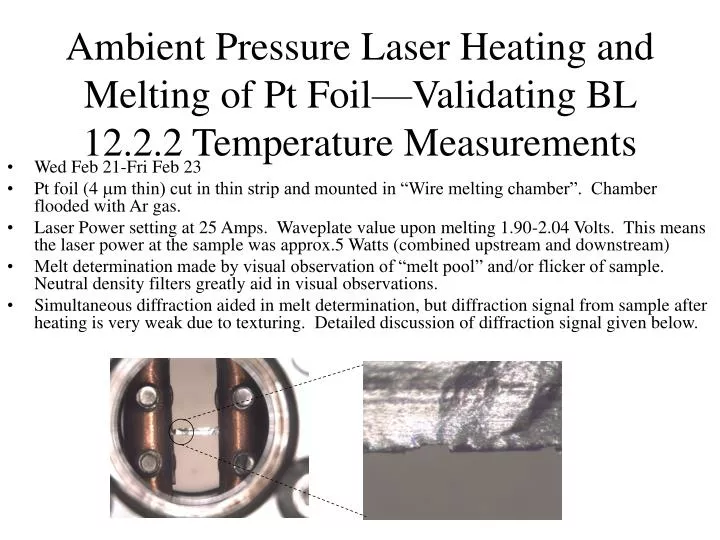
Ambient Pressure Laser Heating and Melting of Pt Foil—Validating BL 12.2.2 Temperature Measurements. Wed Feb 21-Fri Feb 23 Pt foil (4 m m thin) cut in thin strip and mounted in “Wire melting chamber”. Chamber flooded with Ar gas.

E N D
Ambient Pressure Laser Heating and Melting of Pt Foil—Validating BL 12.2.2 Temperature Measurements • Wed Feb 21-Fri Feb 23 • Pt foil (4 mm thin) cut in thin strip and mounted in “Wire melting chamber”. Chamber flooded with Ar gas. • Laser Power setting at 25 Amps. Waveplate value upon melting 1.90-2.04 Volts. This means the laser power at the sample was approx.5 Watts (combined upstream and downstream) • Melt determination made by visual observation of “melt pool” and/or flicker of sample. Neutral density filters greatly aid in visual observations. • Simultaneous diffraction aided in melt determination, but diffraction signal from sample after heating is very weak due to texturing. Detailed discussion of diffraction signal given below.
Pre&Post Heat Pt Foil Post-heating observations support melting with appearance of holes in foil, and foil having a different (glassy?) texture. PreHeating PostHeating ~25mm
Ambient Pressure Laser Heating and Melting of Pt Foil • Temperature calculation is done by fitting data (corrected for system response) to the Planck function in a wavelength range of 600-800 nm. No wavelength dependent emissivity was applied to the data. • The melting temperature is calculated as the average of the last temperature when a “solid” observation is made and the first determination when a “melt” observation is made. • For 3 separate runs with observations made both upstream and downstream, the average melt temperature is determined as 2052+/-29 K. This is close to the literature value of 2041 K.
Temperature Profile during melt observation of ambient pressure Pt foil
Temperature Vs Laser Power • Temperature vs total power at sample position (upstream + downstream) • Plot levels off at Pt Tm • Another supporting piece of evidence for melt indication
X-ray diffraction during laser heating of Pt foil Diffraction signal from Pt foil at ambient condition right after mounting foil before any heating 20 keV Dist: 316.974 mm
Diffraction signal almost completely disappears on a mm-area after heating to moderate temperatures (barely coupling). 1 single diffraction spot left.
Most intense D-value corresponds to (111) of Pt. ~ 2.27 Å (unsure of why spot is split into 3 peaks) residual strain?
Room Temperature During Heating
Integrated Pt Spot During Heating DT =~2000K a~1e-5 dd/d ~ 2e-5 d ~ 2.25 => d + dd = 2.295 Spot broadens and shifts to higher dsp. Confirms the alignment of x-ray and laser (diffraction from laser heated spot)
After melting most intensity recovered to the lowest of the 3 peaks