Download
1 / 35
350 likes | 434 Vues
Enlarging the Options in the Strategy-based Transit Assignment. Isabelle Constantin and Michael Florian INRO. Motivation Computing logit choice of strategies Distribution of flow between connectors Distribution of flow between attractive lines Conclusions. Contents.

E N D
Enlarging the Options in the Strategy-based Transit Assignment Isabelle Constantin and Michael Florian INRO TRB Applications Conference Reno 2011
Motivation Computing logit choice of strategies Distribution of flow between connectors Distribution of flow between attractive lines Conclusions Contents TRB Applications Conference Reno 2011
Strategy-based Transit Assignment The optimal strategy algorithm is well understood and field tested Extended successfully to congested transit assignment and capacitated transit assignment Further extensions can provide a richer set of transit modeling features TRB Applications Conference Reno 2011
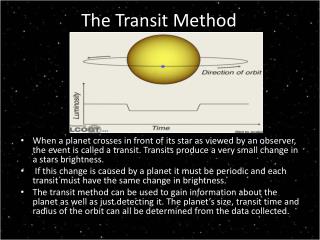
Deterministic vs Stochastic Strategies Currently in an optimal strategy All the flow at a node either 1. leaves by the best walk link, or 2. waits at the node for the first attractive line to be served Logit choice of strategies A logit model can be used to distribute the flow at a node between ride and walk options: 1. leaving by the best walk link or other “efficient” walk links 2. waiting at the node for the first “efficient” line to be served TRB Applications Conference Reno 2011
Adding a Walk-to-line Option: a Small Example 25 minutes O D 10 min 6 min 7 min B A 4 min 4 min Line Headway 12 min 12 min 30 min 6 min The demand from O to D is 100 TRB Applications Conference Reno 2011
The Optimal Strategy 50 trips O D 41.67 trips 50 trips B A 8.33 trips Line Headway 12 min 12 min 30 min 6 min Expected travel time 27.75 min TRB Applications Conference Reno 2011
Adding a Walk-to-transit Option 25 minutes Line Headway 12 min 12 min 30 min 6 min 10 min 6 min 15 min O E D 10 min 6 min 7 min B A 4 min 4 min New walk path is 26 min TRB Applications Conference Reno 2011
Adding a Walk-to-transit Option 25 minutes Line Headway 12 min 12 min 30 min 6 min 10 min 6 min 15 min O E D 10 min 6 min 7 min B A 4 min 4 min First strategy time is 27.75 min TRB Applications Conference Reno 2011
Adding a Walk-to-transit Option 25 minutes Line Headway 12 min 12 min 30 min 6 min 10 min 6 min 15 min O E D 10 min 6 min 7 min B A 4 min 4 min Second strategy time is 26.00 min TRB Applications Conference Reno 2011
Adding a Walk-to-transit Option 25 minutes Line Headway 12 min 12 min 30 min 6 min 10 min 6 min 15 min O E D 10 min 6 min 7 min B A 4 min 4 min New walk path is 26 min (vs 27.75 min) Optimal strategy is to walk to the orange line TRB Applications Conference Reno 2011
Logit Choice of Strategies 22.9 trips Line Headway 12 min 12 min 30 min 6 min 10 min 54.2 trips O E D 3.82 trips 22.9 trips B A 19.08 trips Logit choice of strategies (with scale = 0.1) First strategy 45.8 trips Second strategy 54.2 trips TRB Applications Conference Reno 2011
Adding a Walk-to-transit Option 25 minutes Line Headway 12 min 12 min 30 min 6 min 10 min 6 min 17 min O E D 10 min 6 min 7 min B A 4 min 4 min The travel time of the orange line is increased by 2 minutes to 17 minutes TRB Applications Conference Reno 2011
Logit Choice of Strategies 25 minutes Line Headway 12 min 12 min 30 min 6 min 10 min 6 min 17 min O E D 10 min 6 min 7 min B A 4 min 4 min Second strategy time is now 28.00 min TRB Applications Conference Reno 2011
Adding a Walk-to-transit Option 25 minutes Line Headway 12 min 12 min 30 min 6 min 10 min 6 min 17 min O E D 10 min 6 min 7 min B A 4 min 4 min New walk path is 28 min vs 27.75 min Optimal strategy does not use the walk to the orange line TRB Applications Conference Reno 2011
Logit Choice of Strategies 25.3 trips Line Headway 12 min 12 min 30 min 6 min 10 min 49.4 trips O E D 4.2 trips 25.3 trips B A 21.1 trips Logit choice of strategies (with scale = 0.1) First strategy 45.8 50.6 trips Second strategy 54.2 49.4 trips TRB Applications Conference Reno 2011
Motivation Computing logit choice of strategies Distribution of flow between connectors Distribution of flow between attractive lines Conclusions Contents TRB Applications Conference Reno 2011
Option 1 Generate a set of paths by O-D pair prior to the execution of the route choice algorithm Drawbacks the paths are generated by using heuristics,so the path choices are somewhat arbitrary the paths are processed by O-D pair,so the computation time increases as the square of the number of zones How Can One Enlarge the Choice Set? TRB Applications Conference Reno 2011
Option 2 Enlarge the set of walk links and transit line segments that are considered in the transit assignment by using a well defined criterion Advantage This preserves the computations by destination, so the computation time increases only linearly with the number of zones This is the approach that we have chosen How Can One Enlarge the Choice Set? TRB Applications Conference Reno 2011
The optimal strategy algorithm is first modified to compute simultaneously at each node two values: The best expected travel and wait times from a node to the destination either: by boarding a vehicle at the node, and by walking to another node(stop) to board a vehicle. Modified Strategy Computation TRB Applications Conference Reno 2011
Then, any “efficient arcs” or “efficient line segments" are included, in addition to those of the optimal strategy, by using the criteria: a walk arc is efficient if, by taking it, one gets nearer to the destination a transit segment is efficient if, by boarding it, the best alighting stop is nearer to the destination Node likelihoods are computed recursively in order to obtain the probabilities (proportions) of all the strategies included Modified Strategy Computation TRB Applications Conference Reno 2011
Another Example The demand is 100 in each direction TRB Applications Conference Reno 2011
Another Example: Optimal Strategy TRB Applications Conference Reno 2011
Scale: 0.2 Logit Choice of Strategies TRB Applications Conference Reno 2011
There is another way to ensure that more than one connector is used to access the transit services: Apply the logit choice only to the connectors by considering the length of each connector and the expected travel time to destination from the accessed node Distribution of Flow Between Connectors TRB Applications Conference Reno 2011
Scale: 0.2 Cut-off: 0.01 Logit Choice Only on Connectors TRB Applications Conference Reno 2011
Another Example: Optimal Strategy TRB Applications Conference Reno 2011
Optimal strategy when eastbound tram time is increased Distribution of Flow – Increased Tram Time TRB Applications Conference Reno 2011
Logit on strategies when tram ride time is increased Distribution of Flow – Increased Tram Time TRB Applications Conference Reno 2011
Logit choice only on connectors Distribution of Flow – Increased Tram Time TRB Applications Conference Reno 2011
The issues that are addressed Computinglogit choice of strategies Distribution of flow between connectors Distribution of flow between attractive lines Conclusions Contents TRB Applications Conference Reno 2011
Optimal strategy assignment: the flow at a transit node is distributed based on frequency pl = fl / fwhere f = sum of the frequency of the attractive lines Suboptimal strategy taking into account line travel times: the flow at a transit node can also be distributed based on frequency and time to destination by giving priority to the faster lines pl = p_adjustl * fl / fwhere the adjustment factor is computed as and the fastest line is considered first Distribution of Flow Between Attractive Lines TRB Applications Conference Reno 2011
Optimal Strategy Distribution of Flow Between Attractive Lines TRB Applications Conference Reno 2011
Logit choice of strategies and transit time to destination Distribution of Flow Between Attractive Lines TRB Applications Conference Reno 2011
Motivation Logit choice of strategies Distribution of flow between connectors Distribution of flow between attractive lines Conclusions Contents TRB Applications Conference Reno 2011
The consideration of a richer set of strategies Inclusion of walk in “sub-optimal” strategies Modeling of uneven population distribution in large zones Evaluation measures based on log-sum computations Without losing any computational efficiency … Enhanced modeling possibilities TRB Applications Conference Reno 2011