Download
1 / 1
20 likes | 131 Vues
Professor Steve Burges retirement symposium , March 24 - 26, 2010, University of Washington. Drought assessment and monitoring using hydrological modeling and satellite data Hui Liu a , Qiuhong Tang b , Dennis P. Lettenmaier b

E N D
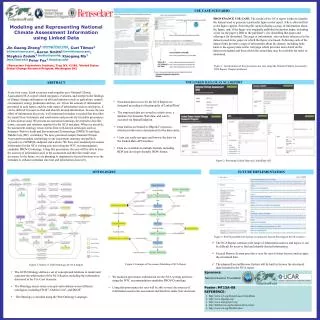
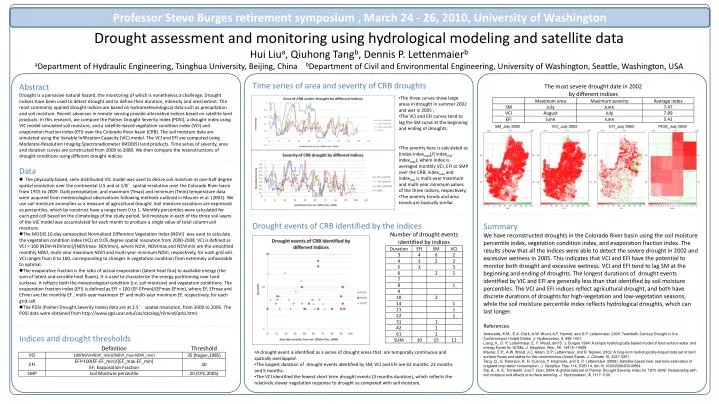
Professor Steve Burges retirement symposium , March 24 - 26, 2010, University of Washington Drought assessment and monitoring using hydrological modeling and satellite data Hui Liua, Qiuhong Tangb, Dennis P. Lettenmaierb aDepartment of Hydraulic Engineering, Tsinghua University, Beijing, China bDepartment of Civil and Environmental Engineering, University of Washington, Seattle, Washington, USA Time series of area and severity of CRB droughts Abstract Drought is a pervasive natural hazard, the monitoring of which is nonetheless a challenge. Drought indices have been used to detect drought and to define their duration, intensity and areal extent. The most commonly applied drought indices are based on hydrometeorological data such as precipitation and soil moisture. Recent advances in remote sensing provide alternative indices based on satellite land products. In this research, we compare the Palmer Drought Severity Index (PDSI), a drought index using VIC model-simulated soil moisture, and a satellite-based vegetation condition index (VCI) and evaporation fraction index (EFI) over the Colorado River basin (CRB). The soil moisture data are simulated using the Variable Infiltration Capacity (VIC) model. The VCI and EFI are computed using Moderate-Resolution Imaging Spectroradiometer (MODIS) land products. Time series of severity, area and duration curves are constructed from 2000 to 2008. We then compare the reconstructions of drought conditions using different drought indices. • The three curves show large areas in drought in summer 2002 and wet in 2005 ; • The VCI and EFI curves tend to lag the SM curve at the beginning and ending of droughts; • The severity here is calculated as (index-indexmax)/( indexmin-indexmax), where index is averaged monthly VCI, EFI or SMP over the CRB, indexmax and indexmin is multi-year maximum and multi-year minimum values of the three indices, respectively; • The severity trends and area trends are basically similar. • Data • The physically based, semi-distributed VIC model was used to derive soil moisture at one-half degree spatial resolution over the continental U.S and at 1/8°spatial resolution over the Colorado River basin from 1915 to 2009. Daily precipitation, and maximum (Tmax) and minimum (Tmin) temperature data were acquired from meteorological observations following methods outlined in Maurer et al. (2002). We use soil moisture anomalies as a measure of agricultural drought. Soil moisture varaitions are expressed as percentiles, which by construct have a range from 0 to 1. Monthly percentiles were calculated for each grid cell based on the climatology of the study period. Soil moisture in each of the three soil layers of the VIC model was accumulated for each month to produce a single value of total column soil moisture. • The MODIS 16-day composited Normalized Difference Vegetation Index (NDVI) was used to calculate the vegetation condition index (VCI) at 0.05 degree spatial resolution from 2000-2008. VCI is defined as VCI = 100 (NDVI-NDVImin)/(NDVImax- NDVImin), where NDVI, NDVImax and NDVImin are the smoothed monthly NDVI, multi-year maximum NDVI and multi-year minimum NDVI, respectively, for each grid cell. VCI ranges from 0 to 100, corresponding to changes in vegetation condition from extremely unfavorable to optimal. • The evaporative fraction is the ratio of actual evaporation (latent heat flux) to available energy (the sum of latent and sensible heat fluxes). It is used to characterize the energy partitioning over land surfaces. It reflects both the meteorological condition (i.e. soil moisture) and vegetation conditions. The evaporation fraction index (EFI) is defined as EFI = 100 (EF-EFmin)/(EFmax-EFmin), where EF, EFmax and EFmin are the monthly EF , multi-year maximum EF and multi-year minimum EF, respectively, for each grid cell. • The PDSI (Palmer Drought Severity Index) data are at 2.5° spatial resolution, from 2000 to 2005. The PDSI data were obtained from http://www.cgd.ucar.edu/cas/catalog/climind/pdsi.html. Drought events of CRB identified by the indices Summary We have reconstructed droughts in the Colorado River basin using the soil moisture percentile index, vegetation condition index, and evaporation fraction index. The results show that all the indices were able to detect the severe drought in 2002 and excessive wetness in 2005. This indicates that VCI and EFI have the potential to monitor both drought and excessive wetness. VCI and EFI tend to lag SM at the beginning and ending of droughts. The longest durations of drought events identified by VIC and EFI are generally less than that identified by soil moisture percentiles. The VCI and EFI indices reflect agricultural drought, and both have discrete durations of droughts for high-vegetation and low-vegetation seasons, while the soil moisture percentile index reflects hydrological droughts, which can last longer. References: Andreadis, K.M., E.A. Clark, A.W. Wood, A.F. Hamlet, and D.P. Lettenmaier, 2005: Twentieth-Century Drought in the Conterminous United States. J. Hydrometeor. 6, 985-1001. Liang, X., D. P. Lettenmaier, E. F. Wood, and S. J. Burges 1994: A simple hydrologically based model of land surface water and energy fluxes for GCMs, J. Geophys. Res., 99, 14415–14428. Maurer, E.P., A.W. Wood, J.C. Adam, D.P. Lettenmaier, and B. Nijssen, 2002: A long-term hydrologically-based data set of land surface fluxes and states for the conterminous United States, J. Climate 15, 3237-3251. Tang, Q., S. Peterson, R. H. Cuenca, Y. Hagimoto, and D. P. Lettenmaier (2009), Satellite-based near-real-time estimation of irrigated crop water consumption, J. Geophys. Res. 114, D05114, doi:10.1029/2008JD010854. Dai, A., K. E. Trenberth, and T. Qian, 2004: A global data set of Palmer Drought Severity Index for 1870-2002: Relationship with soil moisture and effects of surface warming. J. Hydrometeor., 5, 1117-1130. Indices and drought thresholds • A drought event is identified as a series of drought areas that are temporally continuous and spatially overlapped. • The longest duration of drought events identified by SM, VCI and EFI are 61 months, 22 months and 5 months. • The VCI identified the fewest short term drought events (3 months duration), which reflects the relatively slower vegetation response to drought as compared with soil moisture.