Download
1 / 44
510 likes | 891 Vues
Chapter 8 Common Stock Valuation. What is the Intrinsic value and how it is different from the market price How to calculate the intrinsic value. What are the fundamentals of security evaluation.( RRR , time, and size of CFs ) The Discount Cash Flow models to evaluate common stock .

E N D
Chapter 8Common Stock Valuation What is the Intrinsic value and how it is different from the market price How to calculate the intrinsic value. What are the fundamentals of security evaluation.(RRR, time, and size of CFs) The Discount Cash Flow models to evaluate common stock
The Essence of Valuation • One of the main objectives of valuation is to estimate the intrinsic value. • One of the main uses of the intrinsic value is to determine if we are paying the fair value for the security (Common stocks in this case) or its • Overvalued (intrinsic value<market price) • Undervalued (intrinsic value>market price) • Fairly valued (intrinsic value=market price)
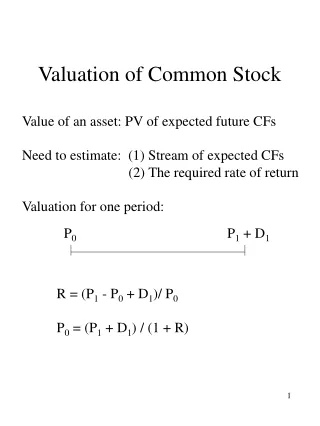
What is the Intrinsic Value? And what is the difference between it and the market price? • Intrinsic value: • An estimation of the stock “true” value • Not observable hard to estimate subjective. • The more info, the better the estimation of the stock true price • More info, the better is our estimation. • Its basically the PV of the future cash flows that the asset will generate. These cash flows will be discounted at a required rate of return (rrr) that reflect the riskiness of cash flows to the investor. • Market Price: • Is the value of the stock determined by a competitive marketplace. • It is observable, especially for publicly traded firms. • but possible incorrect • In equilibrium it is expected that intrinsic value is equal to the market price.
Determining the Intrinsic value and its determinants • There are 3 determinants of the value of a security: • The size of the furtureCFs (+) • The time of these CF (-) • The discount rate: required rate of return (rrr) (-) • The decision made is: • Overvalued (intrinsic value<market price) • Undervalued (intrinsic value>market price) • Fairly valued (intrinsic value=market price)
Determinants of the IV • Timing of the future CFs. • The required rate of return (rrr)? • Expected Future CFs • In case of Bonds: • Interest payment • Loan Principal. • In Case of Stocks • Future Dividends • Expected Capital gain/loss (when the stock is sold at the end of the holding period.
Determining the rrr • rrr: is the minimum return you require to invest in that stock. • It can be determine using CAPM. (shows the relationship between risk and expected retuns) E(r) = rf + b(Rm-rf) • Thus, rrr should at least compensate you for: • The risk-free rate of interest(return from investing in a zero-risk asset) (delaying consumption) • Risk premium • b (systematic risk) the relevant risk. It shows the riskiness of the stock relative to the market portfolio. The higher more risky is the stock. (b>1), (b<1), and (b=0) stock is riskier, less risky, as risky as market. • Calculated by regressing the stock return on the market return • (Rm-rf) Market risk premium (MRP). Shows how risk averse are the market participants. The more risk averse, the higher the premium. (see next slide)
Interpretation of Beta • If beta = 1.0, the security is just as risky as the market (stock is as volatile as the market) • This implies that the market portfolio has by definition beta of 1 • If beta > 1.0, the security is riskier than market (stock is more volatile than the market) • If beta < 1.0, the security is less risky than market (stock is less volatile than the market. • If beta is positive ( + )correlation between the stock and the market. (regression line would slope upward) (most likely to observe that) • If beta is negative ( - )correlation between stock and the market (regression line would slope downward) (2there is a small chance to observe such situation) • Beta of zero: means the stock have zero correlation with the market. The movement of the stock is independent from the market movement market risk is ZERO
The Concept of Risk-Aversion • (+) Slope indicate risk averse investors • Investor 2 is more risk averse than investor 1. SML3 B2 A2 SML2 ri (%) A1 SML4 B1 SML1 SML5 • However investor 3 is extremely risk averse. • Investor 4 is risk neutral (his return will not change regardless of the risk involved). Risk, bi • Investor 5 is risk lover (he is willing to accept lower return for more risk)
How to draw the SML in Excel and Make a Decision regarding the stock fair value
Valuing Common Stock • After we determine the fundamentals of security valuation (future CF, timing of CFs, and RRR), we know go to how can we use these fundamentals to evaluate common stock. • There are several model we can use to estimate the current value of a common stock: First: Discount CFs Models (DCF) • Dividend Discount Model (DDM) • Operating FCF Model (OFCF) • Free-cash-flow Model to Equity (FCFE) Second: Relative Valuation Models: Valuing stock relative to other, similar stocks or industry, using valuation ratios such as: • P/E1 ratio. • P/CF1 • P/BV1 • P/Sales1
First: The Discount CF ModelsA. Dividend Discount Model (DDM) Why use Dividends to determine the stock intrinsic value? • Because dividend is a proxy for the firm’s earnings (net income). • Dividends are paid out of earnings. • If net income grows, then dividends grow if the firm maintain the same payout ratio • Expect that dividends to continue in the foreseeable future: • Firms that initiate dividends reveal a good sign to investor, if they do not have any growth opportunities. • So a firm that initiate dividend are going to be less likely to discontinue these dividends because investors will view such action negatively. (dividends are expected to continue in the foreseeable future)
Dividend Discount Model (DDM) The expected price for a stock that pays dividends at end of year 3 will also depend on future expected dividends. Thus, a general form can be: • A stock that pays a dividends. If you are expecting to sell that stock some time in the future (Ex. After 3 years), then the estimate current price should be:
The Constant-Growth DDM This model says that dividend will grow at a constant rate each year. Thus, knowing the most recent dividend (Do) is equivalent to knowing all future dividends. The reason for assuming such assumption is that Usually new firms will have low or negative earnings for several years due to high investments in fixed and working capital. However, earnings after that will start to increase rapidly (growth opportunities). Firm could earn return on investments higher than their rrr by retaining more earning are reinvesting it in the firm. Thus, have high growth periods. Then when the firms matures and its earnings stabilized its earnings will grow at a constant rate. If the firm maintain a constant payout ratio, then the constant growth in earning will cause a constant growth in dividends.
The Constant-Growth DDM Note that for this model to work, it must be rs>g. Also, g must be constant.
The Constant-Growth DDM Rearranging the model we can obtain • The required rate of return should be equal to the stock total return (Dividend yield + capital gain/loss) • This implies that, under the constant-growth DDM, the stock price as well as the dividends will grow at the constant rate g. • If the stock offers a total return>rrr stock is undervalued • If the stock offers a total return<rrr stock is overvalued
If the current market price of the stock is below (above) this value, then the stock is undervalued (overvalued) • If stock offers us a return below (above) the rs, then the stock is overvalued (undervalued) • Also, this means that the stock price next year will growth by 6%. Thus, 30.29(1.06) = 32.11 Example 1 (sheet 2)….What is the maximum price you should pay for a stock that has currently paid $2 dividends and such dividend is expected to grow at a constant rate of 6% forever. The rf rate is 7% and the expected market return is 12%, the stock’s beta is 1.2 The required rate of return on the firm’s stock is rs= rRF + (rM – rRF)b 7% + (12% – 7%)1.2 = 13%
Example 2 (Sheet 2) What is the expected price after 3 years for a stock that has currently paid $2 dividends and such dividend is expected to grow at a constant rate of 6% forever. The required rate of return is 13% • Now, by knowing the estimated price after 3 year, we can do the following:
Example 3 (g=0) (sheet 2) What is the maximum price you should pay for a stock that has currently paid $2 dividends and such dividend is expected to continue forever. The rf rate is 7% and the expected market return is 12%, the stock’s beta is 1.2 The required rate of return on the firm’s stock is rs = rRF + (rM – rRF)b = 7% + (12% – 7%)1.2 = 13% • This mean the stock price is not growing and the total return from the stock is from the dividend yield. 2/15.38=13%
Example 4 (sheet 2) If the stock was expected to have negative growth (g = -6%s forever), would anyone buy the stock, and what is its value? Yes. Even though the dividends are declining, the stock is still producing cash flows and therefore has positive value.
Cont’d Example 4 • Find Expected Annual Dividend and Capital Gains Yields? • Capital gains yield = g = -6.00% • Dividend yield = 13.00% – (-6.00%) = 19.00% = 1.88/9.89 • Since the stock is experiencing constant growth, dividend yield and capital gains yield are constant. • Dividend yield is sufficiently large (19%) to offset negative capital gains.
Two-Stage Growth DDM As mentioned before, Usually new firms will have low or negative earnings for several years due to high investments in fixed and working capital. After that the firm could experience high growth periods by retaining more earnings if they can earn higher return on investments than its rrr. Finally, that high growth rate cannot be sustained for ever due to competition and other factors. Thus, earning growth will decline and expect to growth at a lower long-run constant rate. Thus, the firm could initiate dividends, but that dividend may grow at a fast rate. However, that growth rate is unlikely to continue forever. Thus, the growth rate will start to decline until dividend start to grow at a constant rate.
Examples 5/6 (sheet 3) Example 5: What is the expected current price for a stock that has currently paid $2 dividends. Dividends will grow at a high rate of 30% for 3 years before achieving the long-run growth rate of 6%. The required rate of return is 13% Example 6: What is the expected current price for a stock that has currently paid $2 dividends. Dividends will NOT grow (g=0%) for 3 years before achieving the long-run growth rate of 6%. The required rate of return is 13%
2.301 2.647 3.045 46.114 54.107 = Example 5 (sheet 3) HV refers to horizontal value 0 1 2 3 4 rs = 13% g = 30% g = 30% g = 30% g = 6% 2 3.38 2.6 4.658 4.39
0 1 2 3 4 rs = 13% g = 0% g = 0% g = 0% g = 6% D0 = 2.00 2.00 2.00 2.00 2.12 1.77 1.57 1.39 20.99 25.72 = Example 6 (sheet 3) HV is the horizontal value
A note on the non-constant growth DDM • If the growth rate of dividend is not constant, then stock will grow at rate that is different from that of dividends • Capital gain is NOT going to be equal to g
Example 7 (sheet 4) From Example 5, we were able to determine = 54.11. Since dividend will not grow at a constant rate, then CG ≠ g. Let us examine the stock price for the next 4 years and examine its growth rate.
Cont’d Example 7 (sheet 4) For the first year …….DY = D1/P0 = 2.60/54.11 For the Second year……DY = D2/P1 = 3.38/58.54 For the third year…….DY = D3/P2 = 4.39/62.77 For the fourth year……..DY = D4/P3 = 4.66/66.54
First: Discount CF (DCF) ModelsB. Operating FCF Model Non-operating assets such as marketable securities
Operating FCF Model • OFCF: is the amount of cash available from operations for distribution to all investors (including stockholders and debtholders) after making the necessary investments to support operations. • It’s the operating cash flow after taxes less the reinvestments in fixed assets (capital expenditure) and operating working capital (which is essential to maintain ongoing operation and positive growth) • Thus, OFCF shows the cash available to all investors (capital providers: debt-holders, preferred stock holders, and common stock holders). • Thus, the higher that FCF, the more valuable become the firms (intrinsic stock value will increase).
Calculating Free Cash Flow in 5 Easy Steps Step 1 Step 2 Earning before interest and taxes Operating current assets X (1 − Tax rate) − Operating current liabilities Net operating profit after taxes Net operating working capital Step 3 Net operating working capital Net Operating long-term assets + Total net operating capital Step 5 Step 4 Net operating profit after taxes Total net operating capital this year − Net investment in operating capital − Total net operating capital last year Net investment in operating capital Free cash flow
Alternative Method to Calculating OFCF CAPEX is the additional investment in long-term operating assets. These investments are essential for growth and ongoing operations. These investment goes from renovating a roof of a building all the way to buying buildings, equipment, machinery
Interpretation of OFCF • + FCF: shows that the firms generates more than enough cash from its operations to finance its current investments in fixed assets and working capital. • - FCF: the firm have insufficient internal funds to finance its investments in fixed assets ands working capital. Need to raise additional funds to pay for these investments. • Is negative free cash flow always a bad sign? • NO if the firm is growing. • For such firms, the needed investments in fixed assets and working capital always exceed the cash flows from existing operation. This is not bad as long as these investments are profitable in the future and generate future CFs.
OFCF • Usually there are 3 ways firms are financed: • Common stock (rs) • Debt (rd) • Preferred stock (rsp) : hybrid between common stock and equity, where it guarantees the amount of dividends, but the firm can omit such dividends without exposing the firm to bankruptcy. • Thus, when discounting OFCFto obtain the value of the firm, we must used the weighted average of the minimum acceptable return each investor requires.It is called the weighted average cost of capital (WACC). • To the firm, WACC is the cost of obtained capital • We do not use required rate of return rs
Example 8 (sheet 5) If WACC = 10%, calculate the firm’s intrinsic value (expected value of the stock) if OFCFs for Y1= -5, Y2=10, Y3=20 then OFCFs will keep on growing a the long-run rate of 6%. Also, the firm has 40 million in total debt and preferred stock and has 10 million shares common stock outstanding. Note, that for the first 3 years OFCF grows at a non-constant rate Thus, cannot use the constant growth model. After the 3Y, OFCF will grow at the long-run growth rate of 6% can use the constant growth model. Thus, we must use a 2 stage method.
-4.545 8.264 15.026 398.197 416.942 Cont’d Example 8 (sheet 5) WACC= 10% 0 1 2 3 4 g = 6% -5 10 20 21.20 + + = 40M +
Preferred Stock Evaluation • Hybrid security. • Like bonds, preferred stockholders receive a fixed dividend that must be paid before dividends are paid to common stockholders. • Thus, g=0 • However, companies can omit preferred dividend payments without fear of pushing the firm into bankruptcy.
If preferred stock with an annual dividend of $5 sells for $50, what is the preferred stock’s expected return?
Debt, Preferred stock, and Common Stock. • From an investor's perspective, a firm's preferred stock is generally considered to be less risky than its common stock but more risky than its bonds. • However, from a corporate issuer's standpoint, these risk relationships are reversed: bonds are the most risky for the firm, preferred is next, and common is least risky. • The cheapest form of capital is RE.
Important Note on the DCF models (whether using the Dividend or OFCF) • An important factor in the evaluation process is determining the level of growth (g)-how fast the firm should grow. • The value of the firm depends on future growth in earnings, cash flows, and dividends. • Growth depends on two main issues: • The amount that the firm retains and reinvests in the firm. This is measured by the retention ratio (RR) • RR= (1-payout ratio) = Net income –(Dividends/Net income) • Payout ratio = Dividend/ Net income • The rate of return earned on the reinvested funds. • Can be measured by ROE and ROIC.
Growth Analysis • g here is called the sustainable growth because it represent the maximum level of growth in sales that can be achieved without any external financing (raising debt or equity). • Note the firm cannot achieve the sustainable growth rate unless there are growth opportunities. Thus, it not uncommon to see firms growth at a rate lower than g.
Second: Relative Valuation Models: Second: Relative Valuation Models: Valuing stock relative to other, similar stocks or industry, using valuation ratios such as: • P/E1 ratio. , • Higher PE ratio should be justified by lower risk (decrease in rs, increase in growth (increase in g), or both. • P/CF1 • P/BV1 • P/Sales1
Practical Examples • How to Calculate OFCF and sustainable growth • Look Sheet 6 (Example 9) • The full evaluation process: • See the Walgreen Evaluation Excel file • Calculating stock and market return. • Estimating the required rate of return of common stocks • Estimating the sustainable growth • Performing the Dividend discount model (DDM) • Performing the OFCF Model • This is part of what is expected from your term projects