Download
1 / 15
150 likes | 309 Vues
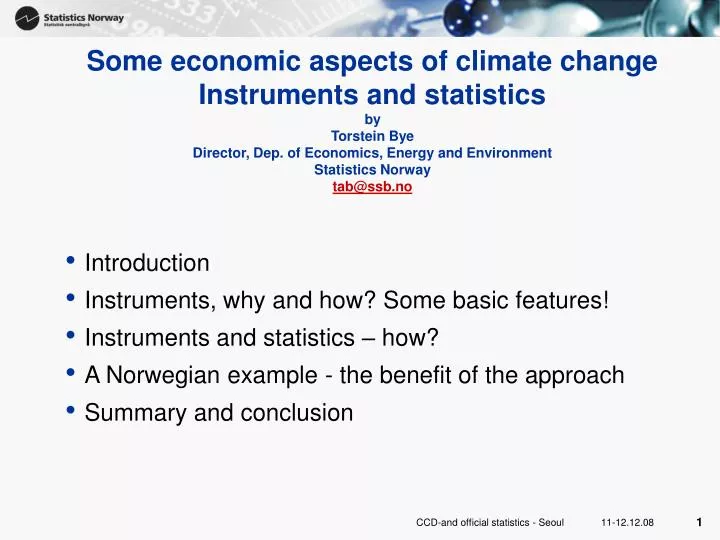
Some economic aspects of climate change Instruments and statistics by Torstein Bye Director, Dep. of Economics, Energy and Environment Statistics Norway tab@ssb.no. Introduction Instruments, why and how? Some basic features! Instruments and statistics – how?

E N D
Some economic aspects of climate changeInstruments and statisticsbyTorstein ByeDirector, Dep. of Economics, Energy and EnvironmentStatistics Norwaytab@ssb.no • Introduction • Instruments, why and how? Some basic features! • Instruments and statistics – how? • A Norwegian example - the benefit of the approach • Summary and conclusion CCD-and official statistics - Seoul
Introduction • The Stern report (Stern, 2008) • Climate change and economic consequences • Cost of mitigation, cost of adaptation • Cost efficient approach to mitigate • Combatting climate change is about instruments. • A range of instruments, • Economic instruments, technology instruments, regulatory instruments etc. • All instruments create shadow prices in the market –i.e. economic instruments • To understand effects are important when deciding upon what statistics we need • We produce a comprehensive number of consistent statistical tables • that allows us to perform consistent analyses both of driving forces, • and the impact of the instruments on emissions • Where does the statistics come from • We exemplify some interesting aspects • by combining actual figures for Norway from a set of such consistent tables. • Concludes CCD-and official statistics - Seoul
Discriminatory taxes Discriminatory subsidies Bye and Bruvoll (2008):Multiple instruments to change energy behaviour – the emperor new clothes Negative externality Positive externality Discrimination Taxes and subsidies CCD-and official statistics - Seoul
Green certificates -supply White certificates -demand Green and White certificates Taxes are bad – subsidies are bad – I do not want to pay GC: Free certificate on supply – purchaser obligation WC: Obligation to save – trade for supplier CCD-and official statistics - Seoul
Brown certificate – or carbon trade Limit the amount: A shadow price occur Initial allocation Distribution of cost and benefits Taxes an subsidies CCD-and official statistics - Seoul
Fundamentally: • All instruments are fundamentally a combination of: • a tax and a subsidy • When producing statistics: • we should remember that and treat them equally Supplementary instruments • Regulation - shadow price – “tax” – “subsidy” • Standards - shadow price – “tax” an “subsidy” • R&D – subsidy – and a “tax” • Market concentration – regulation? • Good for the environment - Tax and subsidy CCD-and official statistics - Seoul
Instruments and statistics CCD-and official statistics - Seoul
Instruments and statistics CCD-and official statistics - Seoul
Instruments and statistics -taxes • Taxes – Table 4x-x • Rate on volumes of proven environmental impact - • Ex. emissions of carbon dioxide. • Data collection and definition – are tax rates split ?: • Simple in theory – difficult in practice ? cf. Eurostat (2001) • Ramsey, environmental, energy, resource, transportation infrastructure, • Bye and Bruvoll (2008b) • Harmonize with the total collected taxes measured in public accounts • (i.e. a tax account matrix). • Steinbach et al. (2008a) • Environmental taxes in the context of the SEEA CCD-and official statistics - Seoul
Instruments and statistics - subsidies • Subsidies – table 5x-x • A measure that keeps prices below their market value for consumers and above market value for producers. • In practice - direct transfers or tax credits (foregone income) • In UNEP (2004) direct transfers, public R&D, preferential tax treatments, price controls and loans-lower than market interest rate • Our paper have a much broader definition (?) of subsidies - only possible to calculate indirectly –cf. market responses – relevant data • Data collection • Subsidies are normally launched to investment projects in terms of a specific amount or a lump sum • to producing facilities based on a production basis (for instance a feed in tariff – i.e. a unit subsidy) • for facilities that want to save the use of input (energy efficiency projects) on the demand side, either lump sum or per unit. • Lump sum subsidies are normally linked to some kind of volume measures, i.e. they may be transformed to a unit measure. • In practice this measure is complex and some data transformation processes are needed to make the measures comparable in units. • Subsidies are normally directed towards detailed projects, i.e. these data are on matrix form, cfr. table 3. • The bright side - government will normally establish some kind of a register • Steinbach et al. (2008b) discusses Environmental subsidies in the context of the SEEA manual. CCD-and official statistics - Seoul
Instruments and statistics –carbon market • Carbon market – table 6x-x • allow trading of these allowances, i.e. a shadow price of the restriction shows up in the market. • A shadow price equal to the tax will produce the same cost efficient environmental output • Two sets of statistical tables • one for the initial assignment of free allowances in volumes (implies also a value transfer – volume times the market price) • a second for a following up of the economic and volume exchange through the trading of emission permits • Aggregates over the columns in table 3: normally directed towards sectors and not activities – but who knows what will happen? • Data source • The assigned amount of allowances may be collected from public registers • grandfathered, i.e. based on historic emissions, • other free emissions (for instance for new facilities). • Surrendered emission, • The “verified” emissions follow from table 3. • Trade of permits – both volumes and values (some may not be tradable) • Allowances – public registers • CDM trade –public registers • JI trade –public registers • Verified emissions – table 3 • Net trade on exchange – accounting principle • The permit market in the context of the SEEA manual and the SNA - Olsen (2008). CCD-and official statistics - Seoul
Instruments and statistics – GC-WC-etc. • Green certificates – table 7x-x • Approval - delivery of the number of certificates by technology choice and firms in public registers • The value of the certificate on the pool /exchange • Energy balance (residential) or the energy account (territorial) framework depends upon national or international framework? • White certificate - table 8x-x • Public register of how much each firm/sector is supposed to save • The principal agent assumption eases the data collection. • Each agent (for instance a distribution company for electricity) has to verify the savings and the cost for each principal (consumer) • Regulation table – table9x-x • Regulations are normally set up by public firms on a firm specific regime. • Public sector should follow up on their own regulation • both the regulated and the verified outcome is registered – consistency check to table 3 • The information needed then should be based on these registers. CCD-and official statistics - Seoul
oct 2008: 25 €/tonne CO2 dec 2008: 15 €/tonne CO2 A Norwegian example (table 3,4,6) multiple studies of driving forces –and instruments? CCD-and official statistics - Seoul
NOK/tonne CO2 Landfills EU/ETS oct 2008: 25 €/tonne CO2 Extraction of oil and gas Households ~0.3 bill. € Sea- and land transport ~0.4 bill.€ ~0.8 bill. € ”Processing emissions mill. tonnes CO2 A Norwegian example–who pays how (to) much? CCD-and official statistics - Seoul
Summary and conclusion • Mitigation is about instruments • Complex instruments introduced • All instruments is a combination of tax and subsidy • Statistics for just one instrument is a lie? • Statistics for all instruments on the same principle • Input/output matrix • Tax rates • Registers • Accounting • Analyses made possible • Driving forces • Effect of instruments – partially/bilaterally/trilaterally/multilaterally CCD-and official statistics - Seoul