Download
1 / 11
110 likes | 562 Vues
Solar Cooker. CAPT- Laboratory Investigation Curriculum Embedded Performance Task Strand I: Energy Transformations. Background. Most people in the United States use an electric stove or a natural gas stove to cook their food. This is not the case in much of the world.

E N D
Solar Cooker CAPT- Laboratory Investigation Curriculum Embedded Performance Task Strand I: Energy Transformations
Background • Most people in the United States use an electric stove or a natural gas stove to cook their food. • This is not the case in much of the world. • Approximately 50% of the people on Earth cook using fire from burning wood. • However, due to overuse, wood is becoming a scarce commodity in many countries. • In addition, burning wood is a major source of air pollution. • One alternative to cooking with wood is using solar cookers.
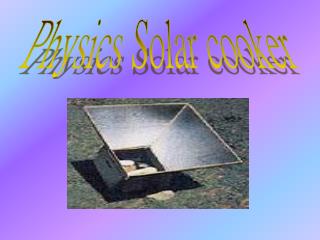
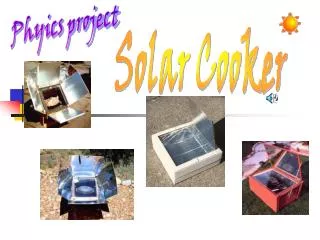
Background • Solar Cookers • Use energy from the sun to cook food without producing any pollution. • While there are many designs for solar cookers, a simple solar cooker can be made from everyday materials. • There are many factors that can influence the effectiveness of a solar cooker including (but not limited to) the: • size of the collector (solar cooker) • orientation of the panel (the direction the cooker is facing) • color of the container
Task • You and your lab partners will design & conduct an experiment to investigate one factor that contributes to the effectiveness of a solar cooker in heating water. • Factors you may want to investigate include the: • shape of the collector (solar cooker) • size of the collector (solar cooker) • color/texture/reflectivity of the collector (solar cooker) • orientation of the collector panel (the direction the cooker is facing) • surface area of the water container • color/texture/reflectivity of the water container • shape of the water container
Materials • You have been provided with the following materials & equipment. It may not be necessary to use all of the equipment that has been provided. • Suggested materials: • heat lamps or sunlight • tape • cardboard/shoe box • thermometer • aluminum foil • water • container for water • colored paper • safety goggles
Designing & Conducting Your Experiment • 1. In your words, state the problem you are going to investigate. • 2. Write a hypothesis using an “If … then … because …” statement that describes what you expect to find and why. • Include a clear identification of the independent & dependent variables that will be studied. • 3. Design an experiment to solve the problem. • Your experimental design should match the statement of the problem & should be clearly described so that someone else could easily replicate your experiment. • Include a control if appropriate & state which variables need to be held constant.
Designing & Conducting Your Experiment • 4. Have your design approved by me before you begin your experiment. • 5. Conduct your experiment. • Take notes & organize your data into tables while conducting your experiment. • Safety note: Students must wear approved safety goggles & follow all safety instructions. • When you have finished, follow the given cleanup procedures.
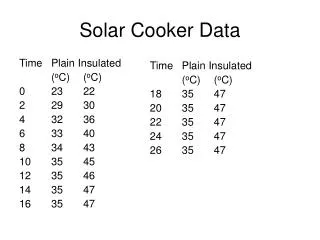
Communicating Your Findings • Working on your own, summarize your investigation in a laboratory report that includes the following: • A statement of the problem you investigated. A hypothesis (“If ... then … because …” statement)that described what you expected to find and why. Include a clear identification of the independent and dependent variables. • A description of the experiment you carried out. Your description should be clear & complete enough so that someone could easily replicate your experiment. • Data from your experiment. Your data should be organized into tables, charts &/or graphs as appropriate. • Your conclusions from the experiment. Your conclusions should be fully supported by your data & address your hypothesis. • Discuss the reliability of your data & any factors that contribute to a lack of validity of your conclusions. Also, include ways that your experiment could be improved if you were to do it again.
Grading Rubric • Statement of Problem and Hypothesis • 3 The problem & hypothesis are stated clearly & completely. Clear identification of independent & dependent variables. • 2 The problem & hypothesis are stated adequately. Adequate identification of independent & dependent variables. • 1 The problem &/or hypothesis are poorly stated. Poor identification of independent & dependent variable. • 0 The statement of the problem &/or hypothesis is very limited or missing altogether. No identification of independent & dependent variables. • Experimental Design • 3 The experimental design matches the stated problem. Variables are held constant. The procedures are clear, complete & replicable. A control is included when appropriate. • 2 The experimental design generally matches the stated problem. Attempt at holding variables constant is made. Procedures are generally complete. Minor modifications or clarifications may be needed. • 1 The experimental design matches the stated problem to some extent. Little attempt to hold variables constant. Procedures are incomplete. Major modifications or clarifications may be needed. • 0 The experimental design does not match the stated problem, is very incomplete or missing. There is no attempt to hold variables constant.
Grading Rubric continued • Data Presentation • 3 Data are well organized & presented in an appropriate manner. • 2 Data are organized & presented in an appropriate manner. Minor errors or omissions may be present. • 1 Data are poorly organized or presented in an inappropriate manner. Major omissions or errors may be present. • 0 Data are very poorly organized or presented in an inappropriate manner or missing altogether. • Conclusions • 3 Conclusions are fully supported by data & address the hypothesis. Reliability of data & validity of conclusions are thoroughly discussed. • 2 Conclusions are generally supported by data & address the hypothesis. Minor errors in interpretation of results may be present. Discussion of reliability of data & validity of conclusions is limited. • 1 Conclusions are supported by data & address the hypothesis to a limited extent. Major errors in interpretation of results may be present. There is little discussion of the reliability of the data or validity of conclusions. • 0 Conclusions are not supported by data, do not address the hypothesis or are missing. There is no discussion of the reliability of data or validity of conclusions.
Grading • Will be done based on the given rubric. • Excellent performance 10-12 points • Proficient performance 7-9 points • Marginal performance 4-6 points • Unsatisfactory performance 0-3 points • Your grade will be quadrupled (x4), so there is a possibility of 48 points total.