Download
1 / 1
10 likes | 80 Vues
Why do satellite-based estimates of whitecap fraction depend on the probing frequency and how to use this for air-sea interaction studies?. Magdalena D. Anguelova and Peter W. Gaiser Remote Sensing Division, Naval Research Laboratory, Washington, DC, USA. maggie.anguelova@nrl.navy.mil.

E N D
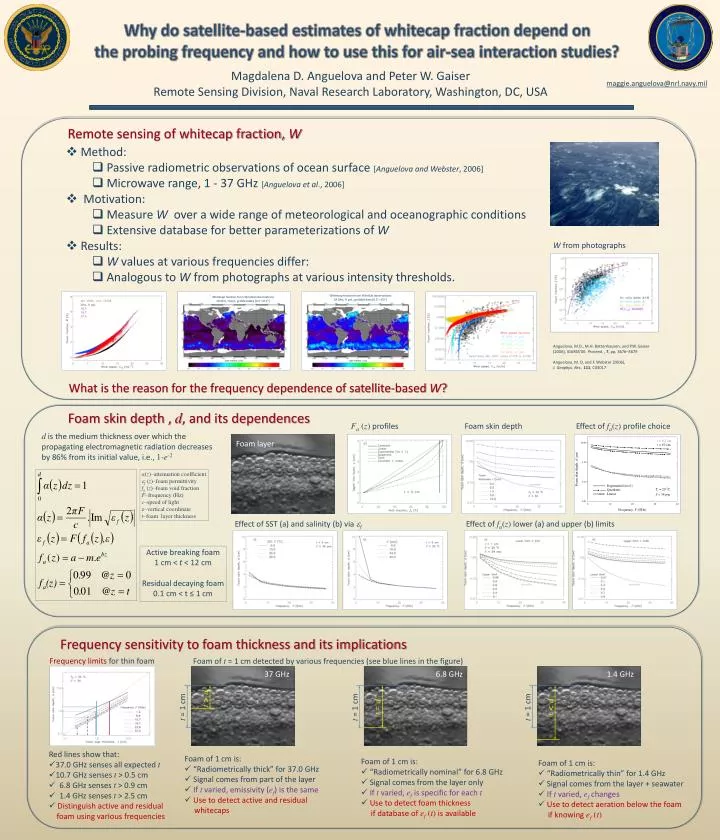
Why do satellite-based estimates of whitecap fraction depend on the probing frequency and how to use this for air-sea interaction studies? Magdalena D. Anguelova and Peter W. Gaiser Remote Sensing Division, Naval Research Laboratory, Washington, DC, USA maggie.anguelova@nrl.navy.mil Remote sensing of whitecap fraction, W • Method: • Passive radiometric observations of ocean surface [Anguelova and Webster, 2006] • Microwave range, 1 - 37 GHz [Anguelova et al., 2006] • Motivation: • Measure W over a wide range of meteorological and oceanographic conditions • Extensive database for better parameterizations of W • Results: • W values at various frequencies differ: • Analogous to W from photographs at various intensity thresholds. W from photographs Whitecap fraction from WindSat observations 10 GHz, H pol., gridded data (0.50.5) Whitecap fraction from WindSat observations 18 GHz, H pol., gridded data (0.50.5) Whitecap fraction from WindSat observations 10 GHz, H pol., gridded data (0.50.5) Anguelova, M.D., M.H. Bettenhausen, and P.W. Gaiser (2006), IGARSS’06 Proceed. ,7, pp. 3676–3679 Anguelova, M. D, and F. Webster (2006), J. Geophys. Res., 111, C03017 What is the reason for the frequency dependence of satellite-based W? Foam skin depth , d, and its dependences Fa(z) profiles Foam skin depth Effect of fa(z) profile choice d is the medium thickness over which the propagating electromagnetic radiation decreases by 86% from its initial value, i.e., 1-e-2 Foam layer α(z)–attenuation coefficient f (z)–foam permittivity fa(z)–foam void fraction F–frequency (Hz) c–speed of light z–vertical coordinate t–foam layer thickness Effect of SST (a) and salinity (b) via f Effect of fa(z) lower (a) and upper (b) limits Active breaking foam 1 cm < t < 12 cm Residual decaying foam 0.1 cm < t ≤ 1 cm Frequency sensitivity to foam thickness and its implications Frequency limits for thin foam Foam of t = 1 cm detected by various frequencies (see blue lines in the figure) 37 GHz 6.8 GHz 1.4 GHz • Red lines show that: • 37.0 GHz senses all expected t • 10.7 GHz senses t > 0.5 cm • 6.8 GHz senses t > 0.9 cm • 1.4 GHz senses t > 2.5 cm • Distinguish active and residual • foam using various frequencies • Foam of 1 cm is: • “Radiometrically thick” for 37.0 GHz • Signal comes from part of the layer • If t varied, emissivity (ef) is the same • Use to detect active and residual • whitecaps • Foam of 1 cm is: • “Radiometrically nominal” for 6.8 GHz • Signal comes from the layer only • If t varied, ef is specific for each t • Use to detect foam thickness • if database of ef(t) is available • Foam of 1 cm is: • “Radiometrically thin” for 1.4 GHz • Signal comes from the layer + seawater • If t varied, ef changes • Use to detect aeration below the foam • if knowing ef(t) t > d t = 1 cm t = 1 cm t < d t = 1 cm t ≈ d