Download
1 / 14

E N D
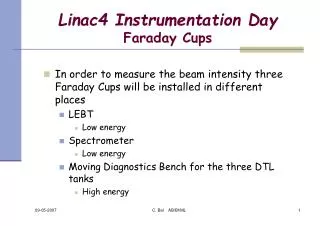
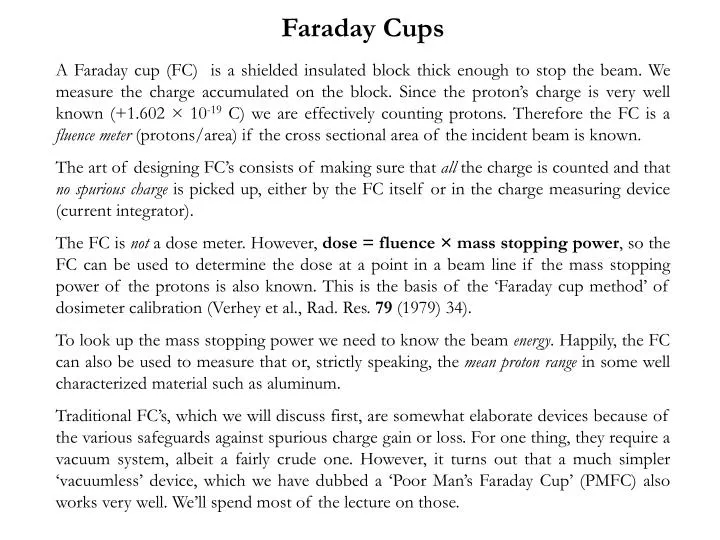
Faraday Cups A Faraday cup (FC) is a shielded insulated block thick enough to stop the beam. We measure the charge accumulated on the block. Since the proton’s charge is very well known (+1.602 × 10⁻¹⁹ C) we are effectively counting protons. Therefore the FC is a fluence meter (protons/area) if the cross sectional area of the incident beam is known. The art of designing FC’s consists of making sure that all the charge is counted and that no spurious charge is picked up, either by the FC itself or in the charge measuring device (current integrator). The FC is not a dose meter. However, dose = fluence × mass stopping power, so the FC can be used to determine the dose at a point in a beam line if the mass stopping power of the protons is also known. This is the basis of the ‘Faraday cup method’ of dosimeter calibration (Verhey et al., Rad. Res. 79 (1979) 34). To look up the mass stopping power we need to know the beam energy. Happily, the FC can also be used to measure that or, strictly speaking, the mean proton range in some well characterized material such as aluminum. Traditional FC’s, which we will discuss first, are somewhat elaborate devices because of the various safeguards against spurious charge gain or loss. For one thing, they require a vacuum system, albeit a fairly crude one. However, it turns out that a much simpler ‘vacuumless’ device, which we have dubbed a ‘Poor Man’s Faraday Cup’ (PMFC) also works very well. We’ll spend most of the lecture on those.
A traditional FC. The interior is evacuated to eliminate spurious charge from ionized air. A decent mechanical pump is good enough. However, that leaves us open to secondary electrons emitted from the window F and/or secondary electrons escaping the beam stop C. To turn those back, we can provide an electric field (G) or a magnetic field (W). Mechanical stress on the insulator I can also cause spurious current, but that decays eventually if the output is grounded. Everything (FC, pump, power supplies) is mounted on a cart which holds the FC at beam height. This is an unwieldy arrangement in cramped quarters. The pump must be powered continuously.
A set of tests to measure output as a function of guard electrostatic field under various conditions of vacuum and magnetic field (Verhey et al.). It was finally concluded that the point at 0 (no electric field, no magnetic field, good vacuum) was a good operating point and that the efficiency there was 0.995 . This FC, traditionally called the ‘new’ Faraday cup (NFC) at the Harvard cyclotron, is still used at the Burr Center but it’s limited to protons below ≈160 MeV. It is the gold standard for proton counting.
Why Not Just Count? It’s easy enough to count individual protons with a scintillation counter (see Ritson, “Techniques of High Energy Physics”, Interscience (1961)). The problem is doing it in a beam where the fluence rate is at a clinical level, ≈ 1010 (p/cm2)/sec. Counters have deadtime, limiting their usefulness to something like 100 KHz (105 protons/sec) if we want to keep the deadtime correction manageable. Make that maybe 50× slower if we are working at a pulsed machine like an FM cyclotron. We can, of course, reduce the beam just for the purpose of FC calibration, but the FC has no charge multiplication. If we reduce the beam more than 1000× we get into the pA regime where we can no longer measure charge accurately enough. Even if we pull out all the stops, we can’t calibrate a FC directly with a counter, by at least three orders of magnitude. What we can do is use an ionization chamber, carefully designed for large multiplication but low recombination, calibrate that with a counter, and then use it to calibrate the FC at low beam. We did that at HCL in the early 1960’s. However, each device is at the limit of its abilities. That, and the increased error inherent in any ‘transfer’ technique, finally led us to conclude that the efficiency was 1 to about ±3%. Though encouraging, that still means the considerations of the previous slide, rather than calibration, provide our most accurate value of NFC efficiency.
A Poor Man’s Faraday Cup This can be built in one day for a few dollars. You can hold it in your hand and put it in just about any beam line. The brass block is separated from the front wall by a thin sheet of Kapton, Mylar or polyethylene. Some arrangement keeps it pressed, but not too tightly, against the front. An interior insulator and shield keep ionized air away from the block. We were feeling pretty good about this and had given a talk at PTCOG when we got a letter from David Bewley, an old protoneer. Turns out he had used such beam stops years earlier in electron beams (and he was not the first), and had then used a similar device for protons to measure range. Our main contribution, in the end, was to show such devices have good efficiency.
From D.K. Bewley, ‘Collector monitors for electron beams,’ Phys. Med. Biol. 16 (1971) 131 No checks of efficiency though.
Measuring Proton Range We discussed this in an earlier lecture but it bears repeating. The mean range of a proton beam is defined as the distance at which the surviving number of protons (not the dose) has fallen by half, counting only protons that stop by electromagnetic (EM) interactions, not nuclear. The experimental arrangement is shown above. The charge collected by the FC per monitor unit is plotted as a function of the absorber thickness placed in front of the FC. In the geometry shown, with the absorber stack at some distance, all multiply scattered protons reach the collector but very few charged nuclear secondaries do.
Measuring Proton Range (continued) Data from the NFC (empty squares) and the PMFC (full) taken with CH2 degraders. The decrease of fluence before the EM ‘cliff’ is due to nuclear reactions. The halfway point defining mean proton range should be measured from the point shown, best determined from the intersection of low order polynomial fits to the two regions. The difference in region A for the two FC’s has nothing to do with their construction. The NFC data were taken with the CH2 perforce rather far from the collector. Therefore it sees only EM protons, which decline immediately as CH2 is introduced. The PMCF experiment had the CH2 right up against the device. It therefore accepts charged nuclear secondaries as well as EM protons and there is no initial decline. The ‘distant’ arrangement is to be preferred. It gives a truer picture of the physics (note the almost constant rate of nuclear interactions) and the AB intersection is found more easily. A B
PMFC for 230 MeV In 2003 we built this PMFC, for use at the Burr Center, using two brass aperture blanks (total 25 lb.). The brass is covered by two layers of 0.003″ Kapton, then a copper-clad Mylar shield, copper side out. At first, such a device is extremely unstable on the bench because trapped static charge on the insulator induces output charge by capacitive coupling whenever the front or back shield moves. It can be improved by a ‘girdle’ that presses the front and back shields firmly in. With time and a bit of radiation the problem goes away and the girdle can be removed. The device is now extremely stable and has a charge defect on the order of 1% relative to the NFC (Ethan Cascio, priv. comm.).
Rate Effect Suppose we wish to determine the charge collection efficiency of a PMFC compared to NFC. We use a monoenergetic beam of small cross section (to be sure the beam fits easily into both devices). First the PMFC is put in the beam, exposed to (say) 10 beam monitor units, and the total charge QPMFC measured. Then NFC is put in the beam, exposed to 10 MU, and QNFC is measured. The desired efficiency is QPMFC/QNFC. Seems simple. Unfortunately, if we repeat the measurement at a different beam intensity (rate) we are very likely to get a different answer. This should always be checked! Rate effect can have several causes. At high rates, either device (FC or monitor IC) can lose counts. In a PPIC this almost always happens at a high enough rate because of recombination which (recall) is aggravated by a small beam and the duty factor of the beam (typically 50 for an FM cyclotron). A FC does not have this problem. Note that if the monitor IC ‘loses’ charge, the output of the device under test (DUT) will increase with rate. At low rates, either the monitor or the FC integrator may suffer from drift current. So rate effect can happen at either very low or very high rates and very often, there is no rate entirely free from it. What to do?
Rate Effect: Measurement and Analysis Measure output vs. MU for each device at various rates. At HCL we did not have a good timer for very short runs so it was better to measure ‘time’ by counting the number of ion source (IS) pulses (nominally 200/sec) for the full exposure. Rate was varied by changing the IS filament current. We measure y = DUT output (say pC/10 MU) as a function of x = monitor output per IS pulse (pC/pulse). Large x → fewer IS pulses → shorter run times → higher rate. If there were no rate effect, y would be flat (independent of x). The next slide shows a set of runs for NFC (our reference), a PMFC and the CH2 MLFC (next lecture). In these runs we used the array integrator to measure output charge for all three devices. The rise towards short times (larger x) is due to monitor recombination. The fall at long times (small x) is due to drift in the DUT’s current integrator. We could do a reasonably good job of analysis by extrapolating the linear part to zero (very long run time, very low rate), but it’s better to let the computer do the work. Fit the data for each DUT separately with the functional form which is linear in A, B, C, the adjustable parameters. A, which dominates at small x (long measurement time) expresses the drift. C, which dominates at large x (short measurement time) expresses monitor saturation. Finally B, the rate independent term, is the corrected DUT output we want to find.
Rate Effect (continued) Similar runs with different integrators on different occasions showed that all ‘vacuumless’ FC’s measured less charge than the NFC by 1-2%. Specifically, the ‘charge defect’ was 2.4/1.6/1.5% for a copper MLFC, a CH2 MLFC, and a single-block PMFC respectively. In some applications, e.g. non-clinical users, that can be ignored or just put in as a correction.
Charge Defect: a Guess All the charge defects are of the same order of magnitude. We’ll learn in our next lecture that charge redistribution inside a multi-layer device (e.g. a proton knocks an electron out of insulator, leaving a positive atom behind) has no effect on the total. Anyway, it can’t happen in a single block. Therefore the entire charge defect almost certainly happens at the entrance. One thing that will cause it for sure in the PMFC is a proton setting an electron in motion in the aluminum box which then punches through the thin Kapton insulator, stopping in the brass. That will contribute –e. If the electron stops in the Kapton that will also contribute somewhat, because it will induce mirror charge both in the grounded aluminum (not measured) and in the brass, in proportion to which is nearer. If all that is true, the solution would be a thicker insulating sheet between the aluminum and the brass. The thickness can be computed to stop all delta rays (energetic electrons), and most electrons will stop very near the aluminum thus reducing the induced charge error as well.
Discussion We have described a conventional Faraday cup (FC) and a poor man’s version, which has an efficiency of about 98.5%. FC’s of either kind can be used for range and fluence measurements. In the early days of proton radiotherapy conventional FC’s were widely used to calibrate the small dosimeters which in turn are used to calibrate the beam monitor for treatments. As proton therapy entered the mainstream, these transfer dosimeters were more frequently calibrated by the ‘air kerma’ method familiar in photon radiotherapy. The mass of gas in the IC is determined by exposure to a 60Co beam at a standards lab. With that, the mean energy per ion pair in the chamber gas, and the stopping power ratio of water to gas, one can then determine absorbed dose to water in a proton beam (ICRU Report 59, 1998). A large dosimetry intercomparison (Vatnitsky et al., Rad. and Onc. 41 (1996) 169) showed that, although dose measurements by this ‘air kerma’ method had a spread of 6% between 13 institutions, the Faraday cup method was a clear outlier, differing from the mean air kerma result by 8%. As a result, the Faraday cup method was abandoned. Since the general adoption of the ICRU 59 protocol, the spread in dose measurements has tightened to about 3% (Vatnitsky et al., Rad. and Onc. 51 (1999) 273). This FC puzzle has never been resolved. It is even claimed (Grusell et al., Phys. Med. Biol. 40 (1995) 1831) that, when slit scattered protons are eliminated, the two methods agree. Nevertheless, the Faraday cup has lost its position in the primary chain of clinical proton dosimetry. It is now just a handy tool for auxiliary beam measurements.