Download
1 / 6
70 likes | 231 Vues
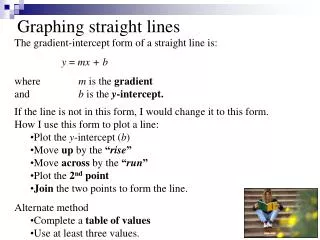
Graphing straight lines. The gradient-intercept form of a straight line is: y = mx + b where m is the gradient and b is the y -intercept. If the line is not in this form, I would change it to this form. How I use this form to plot a line: Plot the y -intercept ( b )

E N D
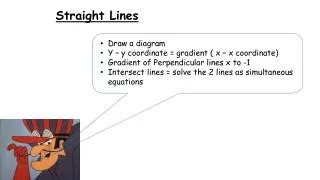
Graphing straight lines The gradient-intercept form of a straight line is: y = mx + b where m is the gradient and b is the y-intercept. If the line is not in this form, I would change it to this form. How I use this form to plot a line: • Plot the y-intercept (b) • Move up by the “rise” • Move across by the “run” • Plot the 2nd point • Join the two points to form the line. Alternate method • Complete a table of values • Use at least three values.
Example 1 Graph the line y = 2x + 1 Method 1 • Plot the point (0, 1) • As the gradient is 2, this is 2/1. • Move up by 2 • Move across 1 • Plot the 2nd point • Join the two points to form the line. Method 2 • Complete a table of values • Use at least three values. y = 2x + 1 –1 0 1 –1 1 3
Example 2 Graph the line 3x + 2y + 4 = 0 Method 1 • Change to y = mx + b 3x + 2y + 4 = 0 2y = –3x – 4 y = –3x/2– 2 • Plot the point (0, –2) • Move down by 3, as the gradient is negative • Move across 2 • Plot the 2nd point • Join the two points to form the line. Method 2 • Change to y = mx + b y = –3x/2– 2 Pick “nice” values for x. Multiples of 2, as the denominator is 2 –2 0 2 1 –2 –5
Graphing straight linesLines parallel to the axes The line x = a is parallel to the y-axis, the y-values change but x always equals a. Example 3 Graph the line x = 3 The line y = b is parallel to the x-axis, the x-values change but y always equals b. Example 4 Graph the line y = –2
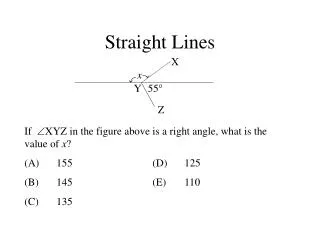
Does a point lie on the line? A point lies on a line if its coordinates satisfy the equation of the line. OR Substitute the point into the equation of the line; if LHS = RHS, the point lies on the line. if LHS ≠ RHS, the point is not on the line Example 5 Does the point (2, 5) lie on the line y = 3x + 1? 5 = 3(2) + 1 5 ≠ 7 (2, 5) IS NOT on the line y = 3x + 1. Example 6 Does the point line 3x + 2y – 22 = 0 pass through the point (4, 5)? 3(4) + 2(5) – 22 = 0 0 = 0 The line 3x+2y–22 = 0 passes through the point (4, 5).
Today’s work Exercise 10:05 Q1-4 Yesterday’s work Exercise 8:03 Q1 a, c, e…o, p, q & r, Q2 & 3 all