Download
1 / 30
300 likes | 417 Vues
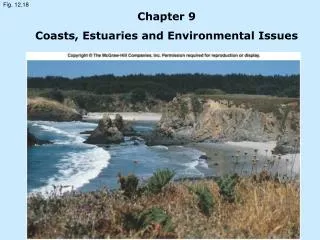
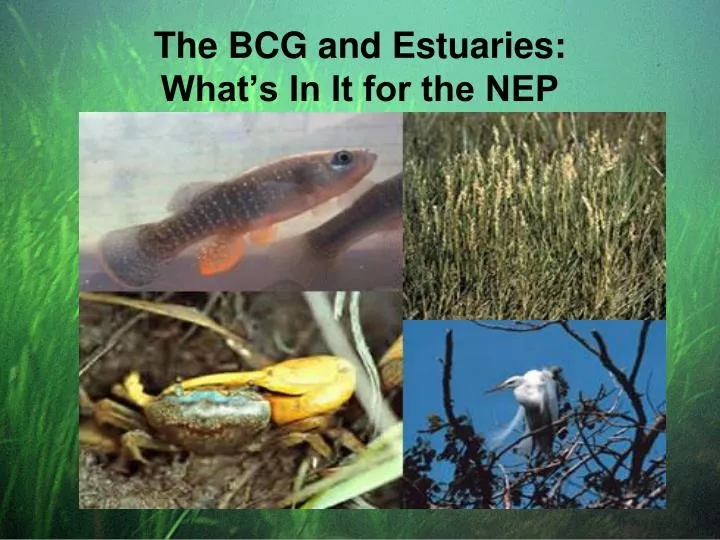
The BCG and Estuaries: What’s In It for the NEP. The Problem. Natural structure & function of biotic community maintained. 1. Minimal changes in structure & function. 2. Evident changes in structure and minimal changes in function. 3. Biological Condition.

E N D
Natural structure & function of biotic community maintained 1 Minimal changes in structure & function 2 Evident changes in structure and minimal changes in function 3 Biological Condition Moderate changes in structure & minimal changes in function 4 Major changes in structure & moderate changes in function 5 6 Severe changes in structure & function LowLevel of Stressors High The BCG Approach
The BCG Approach An integrating scientific framework for assessment and management …. Biologicaldata define environmental condition and system function.Assessment is anchored in “as naturally occurs” or “minimally disturbed”.Assessment is based on a gradient of biological responses derived from ecological attributes. Well-defined methods provide guidance for assigning values of different metrics to levels.These levels provide a “common language” for comparisons.
The BCG Approach As developed for wadeable streams, the BCG evaluates alteration to biological structure and function along a gradient of up to 6 levels -- from “natural structure and function” to “severe changes”. 1 Natural structural, functional, and taxonomic integrity is preserved.
The BCG Approach As developed for wadeable streams, the BCG evaluates alteration to biological structure and function along a gradient of up to 6 levels -- from “natural structure and function” to “severe changes”. 3 Evident changes in structure due to loss of some rare native taxa; shifts in relative abundance; ecosystem level functions fully maintained through redundant attributes of the system.
The BCG Approach As developed for wadeable streams, the BCG evaluates alteration to biological structure and function along a gradient of up to 6 levels -- from “natural structure and function” to “severe changes”. 6 Extreme changes in structure; wholesale changes in taxonomic composition; extreme alterations from normal densities; organism condition is often poor;anomalies may be frequent; ecosystem functions are extremely altered.
Natural Variability Tier 1 2 Effects of continued degradation 3 4 Management/Restoration Plan 5 Can integrate: Designated Uses, 305b/303d, Criteria, monitoring, assessment, diagnostics, management plans, more. Tier6 (Severely Altered)
Natural Variability Tier 1 2 Effects of continued degradation 3 Hypothetical 303d threshold 4 Management/Restoration Plans 5 Can integrate: Designated Uses, 305b/303d, Criteria, monitoring, assessment, diagnostics, management plans, more. Tier6 (Severely Altered)
The BCG Approach • Relationships between biology and the stressor gradient are based on ecological attributes with defined states or levels
The BCG Attributes Attribute I: Historically documented, sensitive, long-lived or regionally endemic taxa Attribute II: Sensitive-rare taxa Attribute III: Sensitive ubiquitous taxa Attribute IV: Taxa of intermediate tolerance Attribute V: Tolerant taxa Attribute VI: Non-native or intentionally introduced taxa Attribute VII: Organism condition Attribute VIII: Ecosystem function Attribute IX: Spatial and temporal extent of stressor effects Attribute X: Ecosystem connectance
. The BCG: Level of detail
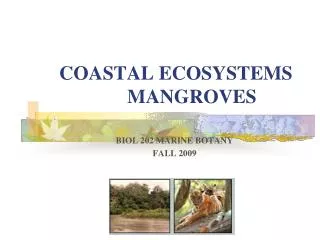
BCG Application Beyond Streams and Wadeable Rivers Variable natural stressors (salinity, DO) Generalist species Complex habitat mosaics Multiple scales Multiple anthropogenic insults Mixing flow patterns
The Challenge Many existing methods for bioassessment are well developed, with measures and indices for: Benthic macroinvertebrates… Fish/shellfish communities… Epifaunal communities… Seagrass condition… Fish pathology … Macroalgal condition… Wetland condition… System metabolism … P/R Ratios … Chl-a concentrations… Phytoplankton communities… Zooplankton communities… Biotope mosaic approaches… And more . . .
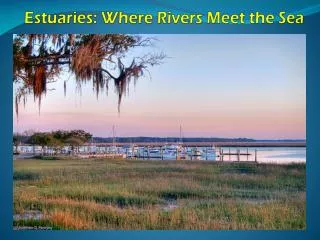
Assessing different scales Biological assessments based on different tools (benthic IBIs, seagrass maps, chlorophyll concentrations, etc.) cannot easily be compared to each other - -evenwithin the same estuary
Selecting indicators Which biological indicators are meaningful… and which should we use?
The challenges What’s the right scale of measurements?
Interconnecting parts And what are the relationships among and within different components of estuarine ecosystems, including the relationship of parts to the whole?
Proposal: E-BCG Opportunity for NEPs to showcase their unique role in: • setting meaningful and publicly embraced goals for waterbodies • communicating condition and trends • establishing measures of accountability • mediating between locally driven protection or restoration actions and the influences of ecological factors driving large-scale system trends
Convened workgroup beginning in 2006 to: • develop a white paper outlining key questions to be considered in developing a conceptual model of processes and parameters shaping estuarine biological community • developed proposal based on white paper for support to engage broad technical expertise to further refine the BCG model for estuarine systems • held three workshops to consider model, refine issues on application to estuaries, solicit and identify NEPs to serve as pilot sites E-BCG So Far
E-BCG Most Recently… • Discussed potential applications and interest with range of NEPs at the November ANEP meeting. • Proposed follow-up steps with October workshop participants, e.g. data exercises in each to test application of proposed framework. • Sought funding (thank you OST and CMB!) for pilot NEPs • Finalized October workshop summary as framework for estuarine BCG proposal
E-BCG Results So Far Five attributes: structure, function, condition, connectivity, non-native species Two scales: whole estuary, single habitat
E-BCG Results So Far Attribute: Structural Extent and Complexity a – whole estuary b – single habitats Attribute: Invasives a – whole estuary b – single habitats Attribute: Condition a – whole estuary b – single habitats Attribute: Function a – whole estuary b – single habitats Attribute: Connectivity a – whole estuary b – single habitats
E-BCG Results So Far • Candidate single-habitat measures: • Habitat-specific community structure: • - Benthic macroinvertebrate indices • - Fish/shellfish indices in specific habitats • - Epifaunal community assessments • Habitat-specific organism condition indices: • - Seagrass condition assessments • - Fish pathology indices (fin rot, tumors, etc) • - Macroalgal condition assessments • Integrative single-habitat assessments
E-BCG Results So Far • Candidate multiple-habitat or whole-estuary measures: • - Whole-estuary measures of trophic status: • - Indices of system metabolism, P/R ratios • - Benthic:pelagic production ratios • - Integrative water-column measures: • - Chl-a, phytoplankton community measures • - Zooplankton community abundance or composition • - Drift macroalgal abundance • Integrative benthic measures: • - Epifaunal community across multiple habitat types • - Habitat mosaic approaches
E-BCG Partners Currently Chris Madden (SFWMD) Peg Pelletier (EPA-AED) Walt Galloway (EPA-AED) Naomi Detenbeck (EPA-AED) Walter Berry (EPA-AED) Marty Chintala (EPA-AED) Ed Dettman (EPA-AED) Tim Gleason (EPA-AED) Lilian Busse (SD Water Board) Diane Gould (EPA-R1) Tim OHiggins (EPA-WED) Hilary Snook (EPA-R1) Jerry Diamond (Tetratech) • Margherita Pryor (EPA-R1) • Susan Jackson (EPA-OW) • Holly Greening (TBEP) • Ed Sherwood (TBEP) • Giancarlo Cicchetti (EPA-AED) • Danielle Kreeger (PDE) • Angela Padeletti (PDE) • Bob Connell (NJ DEP) • Chris Deacutis (NBEP) • Richard Ribb (NBEP) • Martha Sutula (SCCWRP) • Curt Bohlen (Casco Bay EP) • Susan Davies (ME DEP) • Claire Buchanan (UMD)
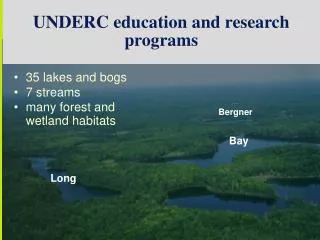
E-BCG Next Steps • Support development of E-BCG framework in pilot NEPs based on specific technical needs • Over next year, test ability to populate the framework with locally-developed data, including their scalability from single-habitat to whole waterbody to system-wide • Pilot NEPs: Casco Bay, Maine; Narragansett Bay, Rhode Island and Massachusetts; Delaware Bay, Delaware, New Jersey, and Pennsylvania; Tampa Bay, Florida; and the San Elijo lagoon, California.
The BCG and Estuaries:What’s In It for the NEP • Identify ecosystem condition with biological information • Set goals • Involve public • Integrate decision-making • Measure and track results • Join community of early practitioners • Access leading edge technical and program support
BCG Model The BCG and Estuaries:What’s In It for the NEP CCMPs Annual Workplans GRPA Measures Improvement Science Social Economic