Download
1 / 25
250 likes | 415 Vues
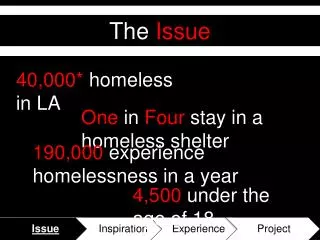
2011 Skid Row Disaster Plan Survey Results. Prepared and Presented By: St. Vincent ’ s Cardinal Manning Center. Participation in Survey. 16 local social service agencies completed the survey 4 of these 16 agencies are non-residential The participating agencies included:

E N D
2011 Skid Row Disaster Plan Survey Results Prepared and Presented By: St. Vincent’s Cardinal Manning Center
Participation in Survey • 16 local social service agencies completed the survey • 4 of these 16 agencies are non-residential The participating agencies included: • LA Mission - Volunteers of America • JWCH - Skid Row Housing Trust • Los Angeles - LACAN Christian Health Center - Downtown Women’s Center • Chrysalis - LAMP Community • Midnight Mission - Emmanuel Baptist Rescue Mission • Weingart Center Association - SRO Housing • Union Rescue Mission - St. Vincent’s Cardinal Manning Center • Skid Row Development Corp.
Disaster Plan Analysis:Emergency Preparedness QuestionsElements of written disaster plan Methods used to conduct survey: Telephone Email Fax In-person
Emergency Preparedness:Factors measured • Minimum of three day supply of food and water for staff and clients. • Back up generator • Disaster kits for staff and clients • System to notify government or first responders (outside of 911) • Written disaster plan
Emergency Preparedness: Factors measured cont’d • Disaster preparedness training for staff • Disaster drills • Disaster-related MOU’s or MOA’s with other agencies • Member of ENLA (Emergency Network of Los Angeles.
Disaster Plan: Factors measured • Hazard/Threat assessment • Evacuation procedures • Fire (or explosion) prevention/control • Earthquake response • Biological outbreak response • Location of disaster supplies • Chain of command structures • Continuity of operations and management plans
Disaster Plan: Factors measured cont’d • Staff/volunteer notification procedures • Steps to activating a disaster plan • How to shut off or restore utilities • Alternate work site locations • Steps on maintaining/restoring critical operations • Security plan • Emergency contact numbers • Critical records back up plan
Trends: Emergency Preparedness • Over 62% (10) of agencies surveyed have a minimum of three day supply of food and water for staff compared to 56% (9) with supplies for clients. • Only 37% (6) have back up generators, all of which have sufficient fuel and are test run regularly.
Trends: Emergency Preparednesscont’d • 44% (7) of the agencies have disaster kits for staff, while 13% (2) have kits for clients. A possible explanation for this could be the transient nature of clients and that only a small percentage are actually in permanent housing.
Trends: Emergency Preparednesscont’d • Only 13% of the agencies surveyed have MOU’s or MOA’s with other agencies and are members of ENLA (Emergency Network of Los Angeles)
Trends: Emergency Preparednesscont’d • 75% (12) agencies have a written disaster plan. Of this number, 100% review/update their plans annually while 92% distribute the plan to staff and conduct regular training (excellent!) • Of the 12 agencies that do conduct disaster drills, 2 conduct them annually, 5 bi-annually, 2 quarterly, 1 monthly, and 2 did not specify how frequently.
Trends: Disaster Plans The trends below are based on the twelve agencies with a written disaster plan. • Survey showed that majority of the surveyed agencies have disaster plans that meet the criteria.
Trends: Disaster Plans cont’d • The main areas that are lacking in the written disaster plans include: • Biological outbreak response (83%) • Alternate site location (83%) • Security plan (75%) • Continuity of operations (83%)
Conclusions/Recommendations The survey findings support the Skid Row Disaster Plan initiative to: • Have a coordinated and clear communication system between the social service agencies and a clear channel of communication from the social service agencies to first responders. • Encourage all social service agencies in Skid Row to develop and update individual disaster plans. • Have a Skid Row disaster plan training workshop