Download
1 / 4

E N D
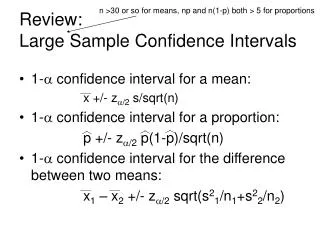
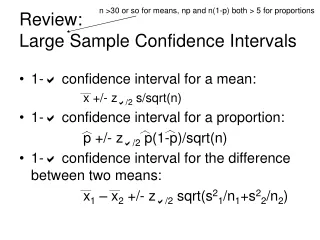
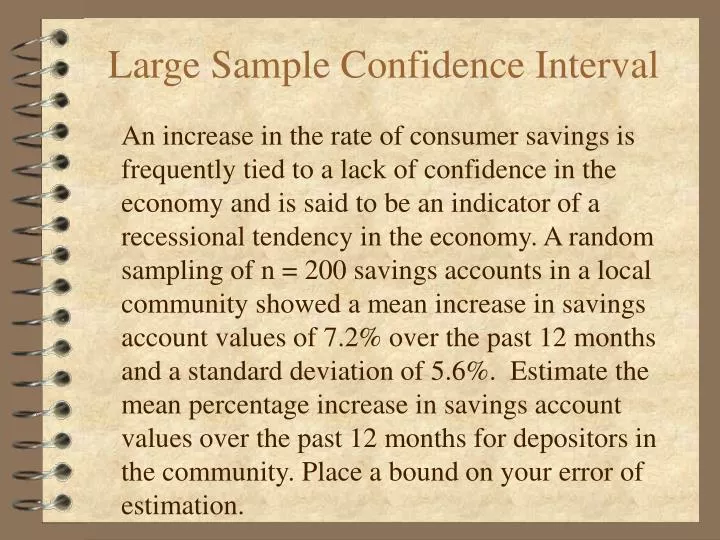
Large Sample Confidence Interval An increase in the rate of consumer savings is frequently tied to a lack of confidence in the economy and is said to be an indicator of a recessional tendency in the economy. A random sampling of n = 200 savings accounts in a local community showed a mean increase in savings account values of 7.2% over the past 12 months and a standard deviation of 5.6%. Estimate the mean percentage increase in savings account values over the past 12 months for depositors in the community. Place a bound on your error of estimation.
Small Sample Confidence Interval Varying costs, primarily labor, make home building vary from one unit to the next. A builder of standard tract homes needs to make an average profit in excess of $8500 per home in order to achieve an annual profit goal. The profits per home for the builder's most recent five units are $8760, $6370, $9620, $8200, and $10,350. A) Find a 95% confidence interval for the builder's mean profit per unit. Interpret this interval B) Does the interval constructed in part (A) contain $8500? Would you conclude that the builder is operating at the desired profit level?
Confidence Interval for Proportions An article titled "Dreaded Tourists Pretty Well Liked in Vermont, Poll Shows" reports on a poll of 504 Vermonters conducted by the University of Vermont and the State Department of Forests, Parks, and Recreation (New York times, July 6, 1986). The random sample, contacted by telephone, answered more than a hundred questions about the respondents' attitudes toward tourists and the impact of tourism on wildlife, recreation, and other factors that affect the quality of life in the state. The survey found, for example, that 63% said tourists were wealthy and 70% said tourists had a good sense of humor. Half believed that tourism would raise the standard of living in Vermont. How accurate are these estimates of the corresponding population percentages? Give an approximate bound on the error of estimation.
Bounds on Proportions In earlier exercises we described the results of a government survey of telephone use by federal employees; particularly, we noted that approximately one in three calls is made for personal (i.e., nonbusiness) reasons (New York Times, June 23, 1986). The government did not listen in on employee's calls to determine whether an employee's phone call was for business or personal reasons. Rather, it randomly sampled the number dialed and checked the source of each number. Suppose that the government wanted to estimate the proportion of nonbusiness calls made by its employees correct to within .02 with probability equal to .99. Approximately how many dialed telephone numbers would have to be included in the sample?