Download
1 / 3
40 likes | 194 Vues
18. Os01g59690. 16. 14. 12. 10. 8. 6. 4. 2. P1. P2. P3. P4. P5. P6. S1. S2. S3. S4. S5. 0. SAM. Leaf. Root. Y leaf. Seedling. 20. Os02g15950. 18. 16. 14. 12. 10. 8. 6. 4. 2. P1. P2. P3. P4. P5. P6. S1. S2. S3. S4. S5. 0. SAM. Leaf. Root. Y leaf.

E N D
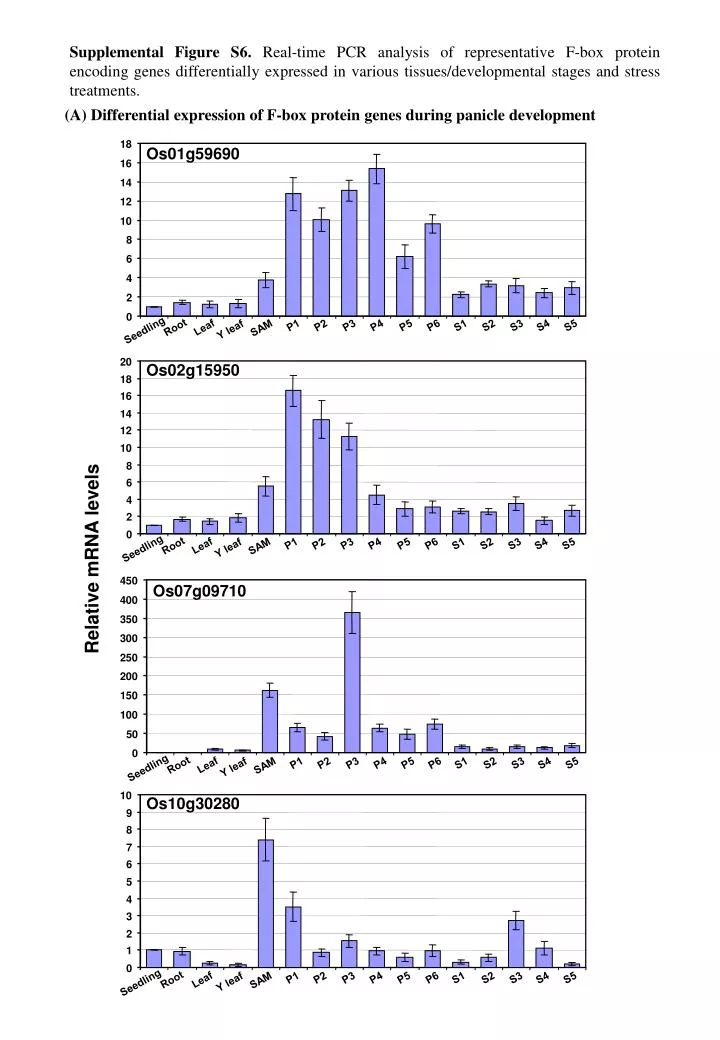
18 Os01g59690 16 14 12 10 8 6 4 2 P1 P2 P3 P4 P5 P6 S1 S2 S3 S4 S5 0 SAM Leaf Root Y leaf Seedling 20 Os02g15950 18 16 14 12 10 8 6 4 2 P1 P2 P3 P4 P5 P6 S1 S2 S3 S4 S5 0 SAM Leaf Root Y leaf Seedling 450 Os07g09710 400 350 300 250 200 150 100 50 P1 P2 P3 P4 P5 P6 S1 S2 S3 S4 S5 0 SAM Leaf Root Y leaf Seedling Os10g30280 10 9 8 7 6 5 4 3 2 1 P1 P2 P3 P4 P5 P6 S1 S2 S3 S4 S5 0 SAM Leaf Root Y leaf Seedling Supplemental Figure S6. Real-time PCR analysis of representative F-box protein encoding genes differentially expressed in various tissues/developmental stages and stress treatments. (A) Differential expression of F-box protein genes during panicle development Relative mRNA levels
7000 6000 Os07g13830 5000 4000 3000 2000 1000 P1 P1 P1 P2 P2 P2 P3 P3 P3 P4 P4 P4 P5 P5 P5 P6 P6 P6 S1 S1 S1 S2 S2 S2 S3 S3 S3 S4 S4 S4 S5 S5 S5 SAM SAM SAM 0 Root Root Root Leaf Leaf Leaf Y leaf Y leaf Y leaf Seedling Seedling Seedling 400 350 Os08g41750 300 250 200 150 100 50 0 8000 7000 6000 Os08g09700 5000 4000 3000 2000 1000 0 (B) Differential expression of F-box protein genes during seed development Relative mRNA levels
12 18 Os02g51350 Os01g47050 16 10 14 8 12 10 6 8 4 6 4 2 2 0 0 Control Dehydration Salt Cold Control Dehydration Salt Cold 100 18 Os04g33820 Os07g09710 90 16 80 14 70 12 60 10 50 8 40 6 30 4 20 2 10 0 0 Control Dehydration Salt Cold Control Dehydration Salt Cold 4 160 Os10g30280 Os07g37400 140 2 Dehydration Salt 120 0 Control Cold 100 -2 80 -4 60 -6 40 -8 20 -10 0 Control Dehydration Salt Cold -12 (C) Differential expression of F-box protein genes under abiotic stress conditions Relative mRNA levels The expression of each gene in different RNA samples was normalized with the expression of internal control gene, UBQ5. The mRNA levels for each candidate gene in different tissue samples were calculated relative to its expression in seedlings (A,B) or control (C) using ΔΔCT method (Applied Biosystems). The values represented are the mean of two biological replicates, each with three technical replicates. Error bars indicate the standard deviation.