Download
1 / 15
150 likes | 274 Vues
STAR-PHENIX Comparison Differences in the f analyses. Richard Seto Collected slides from Charlie, dipali etc. pp comparison. p-p @ 200 GeV. dAu min bias comparison. Min Bias. d + Au @ 200 GeV. dAu comparison. dAu. AuAu comparison. Au-Au data. comments. AuAu PP same

E N D
STAR-PHENIX ComparisonDifferences in the f analyses Richard Seto Collected slides from Charlie, dipali etc
pp comparison p-p @ 200 GeV
dAu min bias comparison Min Bias d + Au @ 200 GeV
dAu comparison dAu
AuAu comparison Au-Au data
comments • AuAu • PP same • AuAu star higher than phenix – all centralities • HENCE • Rcp should be same in both exps – it is • R_AA will be different - phenix suppressed Star not (this is what is seen) • When does hard scattering come in? • dA • pp same • dAu • Central: star slightly higher than phenix. • peripheral- nominal agreement • HENCE • Rcp different in the two experiments with phenix showing suppression • RdA different in two experiments with phenix showing suppression • STAR shows no suppression in both (IS THIS TRUE?) • RdAu phenix is shows “suppression!!!?”
More comments • PHENIX higher than STAR in ALL AU-AU and Central dAu • PHENIX and STAR “agree” in pp and peripheral dAu • PHENIX lower than star on high multiplcity events • Multiplcity dependent problem? • Embedding or efficiency??
AU-Au Current Status of the Run2 DiscrepancyLooking at the integrated yield numbers dN/dy • Publications from Run2 Au+Au data at 200 GeV • STAR in PL B 612 (April 2005) 181-189 • PHENIX in PR C 72 (July 2005) 014903 • One common centrality bin and minimum bias datacan be directly compared using exponential fitting Run2 discrepancy factors for dN/dy 1.69 +/- 0.27 (0 - 10% centrality) 1.79 +/- 0.13 (minimum bias) statisticalerrors only
Update from QM’05 Presentations • Both STAR and PHENIX presented Run4 yield results • Both stated that their Run4 results agreed with their Run2 resultsBy inference the integrated yield discrepancy persists for Run4 • Questions were asked about the STAR-PHENIX discrepancyObvious interest in getting this discrepancy resolved • STAR had a back-up slide not shown quoting a Rafelski et al. preprintwhich questioned the lowest PHENIX mT data point in 0-10% centrality(that back-up slide will be shown later in this presentation) • STAR and PHENIX presented the first v2 results for the f • STAR’s result tended to be higher than PHENIX’s result but the error bars are too large to conclude that there is a discrepancy • The yield discrepancy may diminish the credence of the v2 quotes ? • PHENIX declined to show RdAu results for the f • STAR declined to show Run4 RAA results for the f but PHENIX did show Run4 RAA results claiming f suppression • In its Run2 paper STAR had shown an absence of suppression for the f
RAA and RCP From Run2 STAR (PLB figure) STAR sees almost the same RCP ~0.5 for the f as PHENIX in the Run2 data STAR sees no RAA suppression for the f in the 0-5% centrality bin from Run2 for the pT range 1.5 to 3.4 GeV/c STAR sees RAA ~1.5 enhancement for the f in the 60-80% centrality bin for the pT range 1.5 to 3.4 GeV/c
RAA and RCP from Run4 PHENIX(QM’05 prelim figures) PHENIX claims RAA ~0.4 suppression for the f in the 0-10% centrality bin for the pT range 1.5 to 2.1 GeV/c comparable to effect seen in the p0Suppression decreases in the 60-90% bin, again comparable to the p0 RCP for the f comparable to what STAR has published for Run2
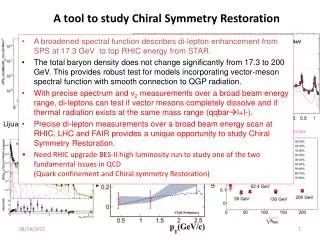
2 . 5 R d A u R ( 6 0 ~ 8 0 / p p ) 2 . 0 A A R ( 0 5 / p p ) A A Ratio 1 . 5 1 . 0 0 . 5 S T A R P r e l i m i n a r y 0 . 0 0 . 0 0 . 5 1 . 0 1 . 5 2 . 0 2 . 5 3 . 0 3 . 5 4 . 0 2 P ( G e V / c ) PHENIX Preliminary: Talk by D. Pal T Update on fRCP STAR Preliminary Talk by Xiangzhou Cai The RCP is well below proton or lambda RCP. Consistent with NCQ scaling expectations. a discrepancy arises between PHENIX and STAR RAA (RAA ≠ RCP)
Question about RdAu for the f in PHENIX Values appear to be systematically low?
Unshown STAR Backup Slide from QM’05(but it shows what they are thinking) Johann Rafelski etc. nucl-th/0412072 Rafelski et al. conjecture that the lowest PHENIX mT data point is a factor of 1.5 too low and this drives the low dN/dy value for PHENIX. Since STAR has more low mT data, then STAR’s result is more believable 0 - 10% centralitySTAR data 0 - 10% centralityPHENIX data My opinion (see next slide):By using a linear plot Rafelski et al. obscure the difference in normalization at the higher mT points. Rafelski et al. also ignore the minimum bias data discrepancy. 0 - 10% centralitySTAR and PHENIX