Download
1 / 4
40 likes | 196 Vues
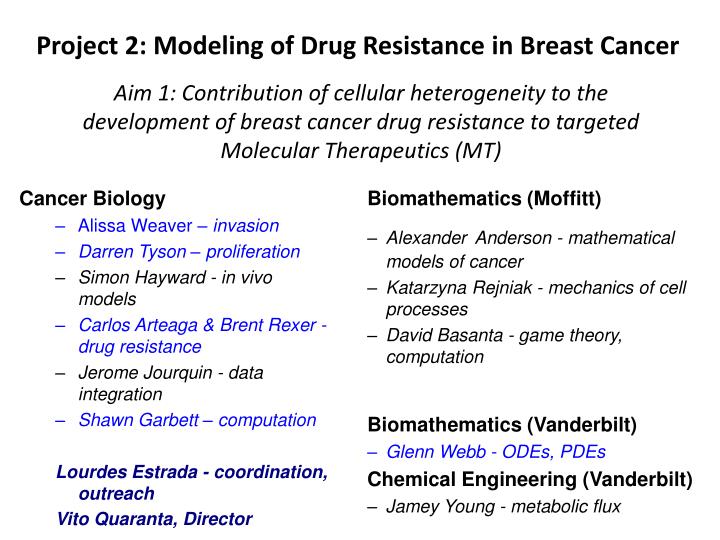
Project 2: Modeling of Drug Resistance in Breast Cancer. Aim 1: Contribution of cellular heterogeneity to the development of breast cancer drug resistance to targeted Molecular Therapeutics (MT). Cancer Biology Alissa Weaver – invasion Darren Tyson – proliferation

E N D
Project 2: Modeling of Drug Resistance in Breast Cancer Aim 1: Contribution of cellular heterogeneity to the development of breast cancer drug resistance to targeted Molecular Therapeutics (MT) Cancer Biology • Alissa Weaver – invasion • Darren Tyson – proliferation • Simon Hayward - in vivo models • Carlos Arteaga & Brent Rexer - drug resistance • Jerome Jourquin - data integration • Shawn Garbett – computation Lourdes Estrada - coordination, outreach Vito Quaranta, Director Biomathematics (Moffitt) • AlexanderAnderson - mathematical models of cancer • KatarzynaRejniak - mechanics of cell processes • David Basanta - game theory, computation Biomathematics (Vanderbilt) • Glenn Webb - ODEs, PDEs Chemical Engineering (Vanderbilt) • Jamey Young - metabolic flux
High Resolution Cellular Responses to MT(proliferation) Non-linear effects Time-dependent sensitivity to MT Erlotinib: 27% inhibition, 24h 43% inhibition, 48h Ensemble Cell Count Data Same as CHX at 48h but 40% less at 24h
InterMitoticTime (IMT) Data EMG Model IMT IMT IMT Quiescent? Quiescent- Growth Model P Q erlotinib CHX DMSO
Conclusions and Future Steps • IC50 may not represent accurately cell responses to MT due to non-linear effects • MT may affect components of EMG differently • The exponential “fat tails” may contain quiescent population of cells Where is the position of oncogene-addicted cells in this high resolution landscape of cellular responses to MT?