Download
1 / 37
370 likes | 482 Vues
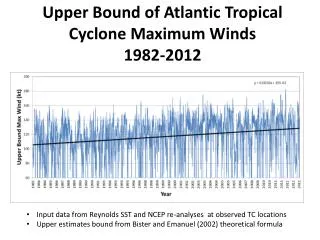
Energy Production, Frictional Dissipation, and Maximum Intensity of a Numerically Simulated Tropical Cyclone. 4/27 2010 蘇炯瑞. Wang, Y., and J. Xu , 2010: Energy production, frictional dissipation, and maximum intensity of a numerically simulated tropical cyclone .

E N D
Energy Production, Frictional Dissipation, and Maximum Intensity of aNumerically Simulated Tropical Cyclone 4/27 2010 蘇炯瑞 Wang, Y., and J. Xu, 2010: Energy production, frictional dissipation, and maximum intensity of a numerically simulated tropical cyclone. J. Atmos. Sci., 67, 97–116.
OUTLINE • Introduction • Model and experimental design • An overview of the simulated TC • Energy production and dissipation in thesimulated TC • Interpretation: a. A Lagrangianθe budget b. A control volume θe budget c. A sensitivity experiment • Summary
Introduction • Emanuel (1995, 1997) assumed that at steady state,namely when the storm reached its MPI, the rate of entropyproduction from the ocean should be approximatelybalanced by the surface frictional ormechanicaldissipation to the ocean
r is the radius, rmis the radius of the eyewalland roughly the radius of maximum wind (RMW) r0is an outer radius far away from the RMW ρ is the air density of the subcloudlayer Tsis the SST|V| is the near-surface wind speeds0* is the saturation entropy of the ocean surface sb is the entropy of subcloud-layer airCk is the exchange coefficient of the entropy flux from the ocean CDis the surface drag coefficient ε is the thermodynamic efficiency of the heat engine, which is defined as ;T0 is the outflow-layer air temperature.
The maximum wind speed, namely, the MPI: “m” Indicates that the value is evaluated near the RMW Maximum wind speed can be calculated by specifying a value of the relative humidity of the subcloud layer outside of rm, SST, and the ratio of the exchange and drag coefficients.
Introduction • Although earlier numerical results from axisymmetricTC models demonstrated that the E-MPI can give anexcellent estimation of the model TC maximum intensity (Rotunno and Emanuel 1987; Emanuel 1995, 1997). • Recent studies show that the numerically simulated TCmaximum intensity can exceed the E-MPI when very high resolution models are used (Persing and Montgomery 2003, 2005; Cram et al. 2007; Yang et al. 2007; Bryan and Rotunno 2009a), higher than the E-MPI by asmuch as 10%–50%. • Near-surface high-entropy air in the eye region could serve as an additional source of energy for the TC heat engine, if the air is transported into the eyewall, and thus considerably increase the TC intensity(Cram et al. 2007).
Introduction • Removal of the high-entropy anomaly in the eye only resulted in a slightly weaker storm as evidenced by the maximum tangential wind speed (reduced by about4%on average). (Bryan and Rotunno 2009a, BR09). • Bryan and Rotunno (2009c) presented a more complete analytic model and demonstrated that the unbalanced flow in the boundary layer could contribute significantly to TC maximum intensity. • From an energy balance point of view, E-MPI expression (1) does not include any approximation for the boundary layer flow.
Motivation • To understand why the E-MPI considerably underestimates the maximum intensity of TCs in numerical simulations and observations. • Show how surface entropy fluxes outside the eyewall contribute to the energy budget in the eyewall and thus the maximum intensity of a TC.
Model and experimental design • Fully compressible,nonhydrostatic equation model TCM4, Wang (2007). • The model has 26 vertical levels : Surface pressure of 1010 hPa and with its top at about 38 km. • Horizontal grid sizes of 67.5, 22.5, 7.5, and 2.5 km have domain dimensions of 251X151, 109 X109, 127X127, and 163X163 grid points. • No large-scale environmental flow. • Convection is mainly active in both the inner-core region and spiral rainbands(200Km). • Cumulus parameterization is not considered even in the two outermost meshes in this study.
An overview of the simulated TC Vmax 68.2m/s
After 168 h of integration in the control experiment 80m/s W
15 km From a regular hurricane structure to an annular hurricane structure.(Knaff et al.2003)
Vmax 68.2m/s RMW 0.32 0.4 averaged between 144 and 192 h 7% stronger 39% weaker 33% weaker
Energy production and dissipation in the simulated TC Total energy production rate (PROD) , PD: Azimuthal mean energy production SH: Sensible heat flux LH: Latent heat flux DHT: Column-integrated dissipative heating rate RAD: Column-integrated heating-cooling rate
Frictional dissipation rate (DISS) Ds: Azimuthal mean frictional dissipation
Developing stage 61.4m/s
HOW FAR CAN BALANCE Area-integrated & averaged between 144-192h RMW 17.5km 37.5km
Interpretation • A Lagrangianθe budget D : horizontal diffusion F : vertical mixing DH : the dissipative heating rate RH : the Newtonian cooling rate
Steady stage flow • The vertical motion can be ignored outside the eyewall. ; D=212m PS:
Interpretation • A control volume θe budget Replace A with θe : HD+VD+DH+RC Lateral and top
Reduction 0.5K in θebelow 1100m reduced the FLXL 1.39 × 10⁹ K kg/s. • Although this is small compared with FLXS about 31% or with all local processes in the control volume about 26.5%. • If the air entering the eyewall is a mixture of air parcels with different radial origins, the FLXL can result 0.5-1K increases in θe . • The surface entropy fluxes outside the eyewall do contribute significantly to the energy budget in the eyewall.
Interpretation • A sensitivity experiment (OE30) • With the surface exchange coefficient (and thus the surface entropy flux) linearly reduced from 100% at a radius of 30 km, corresponding to the eyewall to zero at and outward of radius 45 km. • To quantify the significance of the energy production outside the eyewall and its contribution to the maximum intensity of the simulated TC.
13.5% low 26 hPa high
It seems that there exists a positive feedback between the surface fluxes outside the eyewall and the inner-core size of the storm. • Removal of the surface fluxes outside the eyewall would reduce the storm intensity, suppress convection outside the eyewall, and thus reduce the storm size (Wang 2009). • Energy production outside the eyewall contributes considerably to both the size and maximum intensity of the TC in the simulation.
Summary • Energy production rate and surface frictional dissipation rate are balanced near the radius of maximum wind (RMW) at the time when the storm reaches its MPI (E-MPI). (Underestimate) • Lagrangianθe budget : air parcel in the surface-layer inflow can gain considerable energy from the underlying ocean due to surface entropy flux as it spirals cyclonically inward toward the eyewall. • The control volume mass-weighted θe budget : a small change in θe of the air entering the eyewall in the boundary layer inflow considerably affects the energy budget in the eyewall.
Summary • The underestimation by E-MPI of the maximum intensity of the simulated TC is primarily due to ignoring energy production outside the eyewall as energy production within about 2–2.5 times the RMW is required to balance the surface frictional dissipation under the eyewall. • Sensitivity experiments also show that energy production outside the eyewall is critical not only to the maximum intensity but also to the inner-core size of the simulated storm.