Download
1 / 28
280 likes | 414 Vues
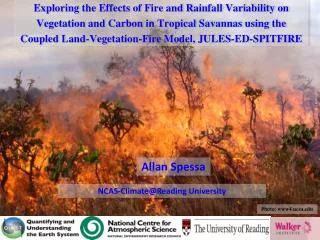
Simulating Climate-Vegetation-Fire Interactions & Emissions: Regional Applications of the LPJ-SPITFIRE Model. Allan Spessa 1,2 , Kirsten Thonicke 3 , Colin Prentice 3. Max Planck Institute for Biogeochemistry, Jena, Germany Hadley Centre (from 2006) Marie Curie Fellow, Bristol University

E N D
Simulating Climate-Vegetation-Fire Interactions & Emissions: Regional Applications of the LPJ-SPITFIRE Model Allan Spessa1,2, Kirsten Thonicke3, Colin Prentice3 • Max Planck Institute for Biogeochemistry, Jena, Germany • Hadley Centre (from 2006) • Marie Curie Fellow, Bristol University • QUEST & Bristol University
Key Research Questions for LPJ-SPITFIRE • 1. Assess long-term changes in vegetation composition and above-ground carbon due to altered fire regimes, at regional and global scales. • 2. Quantify emissions of different trace gases from biomass burning (CO2 etc), at regional and global scales. • Examine effects of regional climate phenomona (e.g. El Nino) on fire activity, vegetation, and emissions. • Investigate changes in human-caused ignition patterns.
rainfall, cloud, temp., radiation LPJ-DGVM population density TrBlEg TrBlRg TeNlEg TeBlEg TeBlSg BoNlEg BoNlSg BoBlSg C3 grass C4 grass (Bare Soil) [CO2] wind speed lightning strike rate texture FIRE MODEL SIMULATES:Number of Fires, Area Burnt, Fire Intensity, Crown Scorch, Plant Mortality, and Emissions of CO2, CO, CH4, VOC, NOx & TPM. Temporal scale = 1 day. Spatial scale = 0.5 deg (flexible). Regional fire model (SPITFIRE) Fire in the Earth System
Key features of LPJ-SPITFIRE • Human and lightning-caused ignition rates.Gridcell variable (calibration data limited). • Surface rate of spread based on Rothermel family of models. ROS is directlyproportional to energy produced by ignited fuel, and also wind. ROS is inversely proportional to the amount of energy required to ignite fuels. • Litter moisture = f (fire danger index); • Grass phenology (‘green-up’ and curing); • Raingreen tree phenology*; • Fire intensity (independent of rate of spread); • Fuel combustion(by fine and coarse fuel classes); • Tree mortality & crown fires = f (scorch height, cambial kill; vegetation-specific attributes); • Land cover change* adjust fire activity and emissions to natural vegetation regions, and • Emission factors (CO2, CO, CH4, VOC, TPM, NOx) • Emissions (tonnes/km2) × trace species × PFT × period (day, month or year). • * Not yet implemented
Progress to date on LPJ-SPITFIRE • Beta version undergoing validation. • Long-term validation data on fire activity collated from several regions, covering most biomes (Iberian Peninsula, North Germany, Russia and Central Asia, Africa, Australia, Western USA, Canada, Borneo, Amazonia). • Data from various sources: satellite and ground observations, processed to a common format for model checking. • First simulation results: • Global, 1960-2000; • Australian Wet-Dry Tropics, 1997-2002; and • Central Asia and Siberia, 1996-2002.
Northern Australia: Observed Mean Annual Area Burnt, 1997-2002 (AVHRR FAA data, DOLA)
Northern Australia: Simulated Mean Annual Area Burnt, 1997-2002 (LPJ-SPITFIRE) East Transect Central Transect
Northern Australia: Simulated Monthly Area Burnt, 1997-2002 (LPJ-SPITFIRE)
Northern Australia: Simulated C4 grass FPC, 2002 (LPJ-SPITFIRE)
Northern Australia: Simulated Tropical Broadleaved Raingreen FPC, 2002 (LPJ-SPITFIRE)
Northern Australia: Simulated Tropical Broadleaved Evergreen FPC, 2002 (LPJ-SPITFIRE)
Northern Australia: Simulated Mean Annual CO2 Emissions (tonnes per sqkm), 1960-2002 (LPJ-SPITFIRE)
Siberia & Central Asia: Observed Mean Annual Area Burnt, 1996-2002 (AVHRR data, Suhkinin et al., 2004) xxxxxxx
Siberia & Central Asia: Simulated Mean Annual Area Burnt, 1997-2002 (LPJ-SPITFIRE) xxxxxxx
Siberia & Central Asia: Simulated Mean Annual CO2 Emissions (tonnes per sq km), 1960-2002 (LPJ-SPITFIRE) xxxxxxx
Next Steps and Future Directions • Complete validation of simulated fire activity against observed fire data from available regional sets. • Validate simulated patterns for Plant Functional Types, above-ground carbon and emissions, where possible. • Account for discrepancies between simulated & observed! • Model Experiments. Address questions concerning climate-vegetation-fire interactions and emission patterns. ----------------------wish list---------------------------- • Simulate seasonal changes in ignition sources e.g. early- vs late- dry season burning in tropical savannas. • Revisit calibration of population density with fire activity for human-caused ignitions. Consider joint effects of land use change. (Data sources? GLC 2000, Ramankutty-Foley, Goldewijk HYDE 3.0) • Incorporate land use effects directly into the model e.g. grazing (tropical savannas) or deforestation rates (humid tropical forests). • Simulate variability in lightning-caused fires (Data source? Optical Transient Detector, Christian et al. 2003). --------------------------------------------------------
Estimating Total Emissions • Total amount of Emissions (E) typically described by the following equation (Seiler and Crutzen 1980), • M = ∑ ( [A]ijt x [B]ij x [C]ijt x [EF]k), where • Ais the monthly (t) burned area (km2) at location ij; • Bis the fuel load (tonnes/km2) expressed on • a dry weight (DM) basis; • C is the fraction of available fuel which burns (the combustion factor); and • EF is the Emission Factor for the kth trace species (g/kg or tonnes/km2).
Reducing uncertainty in emission estimates • New long-term satellite products becoming available (e.g. GLOBCARBON Plummer et al. in progress, Perriera et al. in progress., Camaro et al. 2005 GCB + many others). • Fine temporal &/or spatially resolved optical (e.g. LANDSAT-TM, MODIS ‘Terra’ & ‘Aqua’, Meteosat) for separate emission calculations and testing above products. But, large uncertainties remain with respect to… • How much biomass is available for burning through space and time. (Litter production, crown biomass.) • Relative amount of fine fuels and coarse fuels. (Flaming vs smouldering combustion.) • Fuel moisture. (Flaming vs smouldering combustion.) • What proportion of biomass is combusted. (Fire intensity.)
Northern Australia: Observed Number of Fires (AVHRR FAA data, DOLA)
Northern Australia: Simulated Number of Fires (LPJ-SPITFIRE)
Siberia & Central Asia: Simulated Boreal Needleaved Evergreen FPC, 2000 (LPJ-SPITFIRE) xxxxxxx
Siberia & Central Asia: Simulated C3 grass FPC, 2002 (LPJ-SPITFIRE) xxxxxxx
Siberia & Central Asia: Simulated Temperate Broadleaved Summergreen FPC, 2002 (LPJ-SPITFIRE) xxxxxxx
Siberia & Central Asia: Simulated Boreal Broadleaved Summergreen FPC, 2002 (LPJ-SPITFIRE) xxxxxxx
Siberia & Central Asia: Simulated Boreal Broadleaved Summergreen FPC, 2002 (LPJ-SPITFIRE) expected xxxxxxx