Download
1 / 11
120 likes | 424 Vues
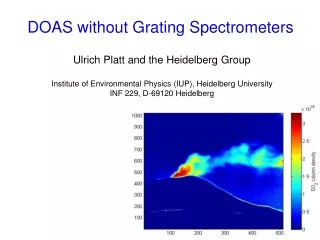
Mini-DOAS. University of California Los Angeles. Jochen Stutz Max Spolaor. What is Mini-DOAS ? . Identify and quantify trace gases using their narrow band absorptions. Airborne remote sensing Slant Column Density (SCD). +1˚ 0˚ -1˚ -1.5˚ -2˚ -2.5˚ -3˚ -4˚ -5˚ -15˚. Rotating

E N D
Mini-DOAS University of California Los Angeles Jochen Stutz Max Spolaor
What is Mini-DOAS ? Identify and quantify trace gases using their narrow band absorptions. Airborne remote sensing Slant Column Density (SCD) +1˚ 0˚ -1˚ -1.5˚ -2˚ -2.5˚ -3˚ -4˚ -5˚ -15˚ Rotating Telescopes Alternating viewing directions
How does Mini-DOAS work? Telescopes for UV, VIS, near-IR PC Electronics Power consumption: 29VDC at 1.4A = 41W Size and Weight:11.8x9.84x8.0 inches; 75pounds including 9L ice-water Scanner Quartz Fibers Optics Vacuum Vessel Ice-Water Spectrometers Insulation SpectrometerAssembly
… on NASA’s Global Hawk Telescopes Spectrometers Quartz fibers
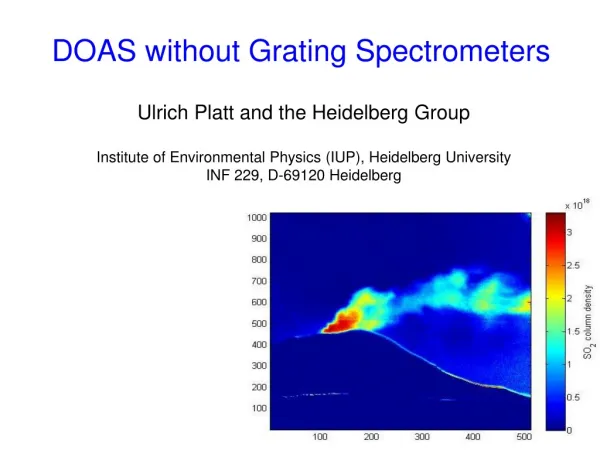
DOAS Identification and quantification of trace gases by their unique narrow band absorption in the open atmosphere Differential Optical Absorption Spectroscopy
BrO and O4 data analysis O4 BrO 0 0 Intensity Intensity 3x10⁻⁴ 9x10⁻³ Species to be measured & DL: NO2 50 ppt HONO 20 ppt BrO 0.75 ppt HCHO 150 ppt SO2 200 ppt glyoxal: ? aerosol extinction (via O4) • O4 fit range: 338-347nm 352-360nm • BrO fit range: 345 – 360nm
ATTREX Data Example +1˚ 0˚ -1˚ -1.5˚ -2˚ -2.5˚ -3˚ -4˚ -5˚ -15˚ Elevation Angle Relative Radiance [counts/ms*scans] Altitude [103m] BrO DSCD [1014molec./cm2] O4 DSCD [1043 molec2./cm5] Universal Time [5th November 2011]
From SCDs to trace gas concentration BAMFs derived via radiative transfer calculations Optimal Estimation Inversion to derive concentration profile c(h) VCD Scattered sunlight SCD
BrO vertical concentration profile retrieval Science flight 2 on 11/05, 18:00 UTC Retrieved BrO profile x1E14 SZA=74° flight level SZA=56° BrO at flight altitude: ~(1.8 ± 0.25) x107 molec/cm3 = (5.0 ± 0.75) ppt Modeled SCDs fit well
BrO vertical profiles Science flight 2 on 11/05 Consecutively retrieved BrO profiles BrO at flight altitude 34°N 30°N
Questions / Issues • Telescope fairing (pressure seal). • Calibration of telescope geometry after installation • Meeting NSF specs for instrument • Instrument has undergone environmental testing at NASA • Fast information on pitch, roll, acceleration ? • Addition of sensor to instrument of from aircraft? • Data archive on C130 server (~5000 spectra each 10kbyte)? • Change of measurement strategy depending on flight status • Profiling through elevation scanning vs limb during ascent/decent