Download
1 / 41
410 likes | 549 Vues
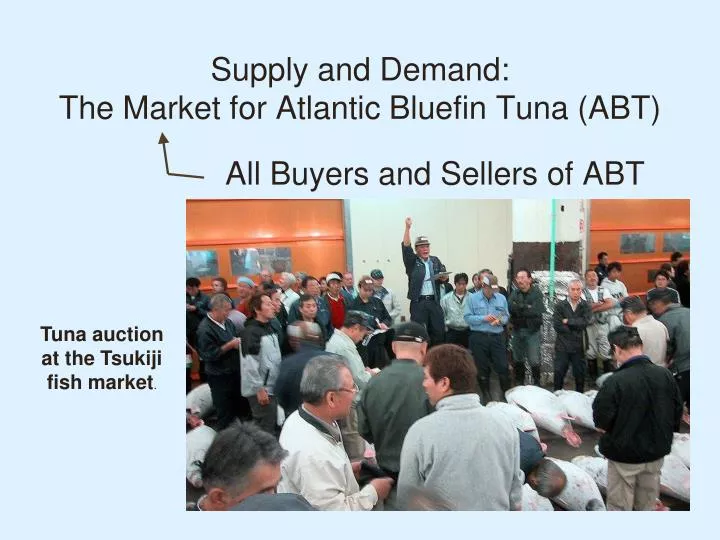
Supply and Demand: The Market for Atlantic Bluefin Tuna (ABT). All Buyers and Sellers of ABT. Tuna auction at the Tsukiji fish market. Cold waters of North Atlantic create extra layers of fat giving BFT a “rich, silky flavor.”. Nicknamed “flying fish”.

E N D
Supply and Demand: The Market for Atlantic Bluefin Tuna (ABT) All Buyers and Sellers of ABT Tuna auction at the Tsukiji fish market.
Cold waters of North Atlantic create extra layers of fat giving BFT a “rich, silky flavor.” Nicknamed “flying fish” because it travels in jets to Japan
Demand Curve: Relationship between Price and Quantity Demanded (QD) holding other factors constant Price Quantity Demanded ($ per lb) (Millions of lbs per year) 20 40 60 30 20 100 10 140
Demand for ABT, 1995 Price Quantity Demanded ($ per lb) (Millions of lbs per year) WTP5 = max willingness to pay for the 5th million lb (e.g., gourmet sushi restaurants). WTP5 D1995 WTP170 WTP170, e.g., cat food producers Quantity (millions of lbs per year)
Law of Demand PABT QD ceribus paribus… need only be true on average KAY-tuhr-uhs PAR-uh-buhs Change Example Illustrated Terminology in the P of the good itself PABT Movement along the demand curve in “quantity demanded”
Change in Price of Good Itself PABT causes QD PABT Illustrated by movement along D P2 P1 D QABT Q2 Q1
Effects of Other Changes Change Example Illustrated Terminology Any other factor “Demand” for Atlantic Bluefin Tuna Shift in Demand ↑PSake Sake & ABT are complements if ↑Psake DABT
Demand Shifts PABT PSake causes in DABT, illustrated by a leftward shift in demand P D2 D1 Q2 Q1 QABT
Determinants of Demand Example 1. Price of PABT in QD Good itself 2. Prices of Related Goods (a) Complements PSake DABT
A California sushi chef discovered that the “oily texture of avocado” is a “perfect substitute for toro” (Wikipedia). Tuna Toro with Avocado Tower Avocado Rolls Toro Rolls Avocados (A) & ABT are substitutes if ↑PA ↑ DABT Avocados (A) & ABT are complements if ↑PA DABT Whether Avocados & ABT are substitutes or complements is an empirical issue.
Determinants of Demand Example 1. Price of PABT in QD Good itself 2. Prices of Related Goods (a) Complements PSake DABT (b) Substitutes PAvocados DABT
Determinants of Demand Example 3. Income (Y) Normal Good: Y D Y DVanity Plates Inferior Good: Y D Vanity Plates are a normal good and 68 Subarus were an inferior good. Y D68Subaru
Determinants of Demand Example • Number • of Buyers Aging of Boomers DCremations Catholic Church 1963: sanctioned C 1997: C allowed at Catholic Mass 5. Tastes DCremations
Supply Curve: Relationship between Price and Quantity Supplied (QS) holding other factors constant Price Quantity Supplied ($ per lb) (Millions of lbs per year) 70 5 80 10 20 100 30 120
Supply of ABT, 1995 Quantity Supplied Price ($ per lb) (Millions of lbs per year) S1995 Quantity (millions of lbs per year)
=min $ to get firms to supply 80 million lbs of ABT = opp cost (resources) of 80th million lb of ABT S1995 Quantity (millions of lbs per year)
“In ports like Gloucester and Seabrook, furious bidding wars broke out, as representatives of Tsukiji auction houses handed thousands in cash to stunned anglers for their hauls… Lobstermen began to put down their traps and take up rods and reels, chasing lucrative catches on slow-moving dragger boats ill prepared for the task.” “The One That Almost Got Away,” Boston Magazine, May 2007 Tuna (long net) Seiner Lobster Dragger
S1995 Opp cost of catching ABT using “dragger boats” is higher than with “tuna seiners” Opp Cost120 > Opp Cost80 opp cost as Q As Q, P must to induce fishing boats pursuing ABT Quantity (millions of lbs per year)
Determinants of Supply Example 1. Price of PABT in QS Good itself 2. Price of Inputs PGas in SABT
Supply Shifts PGas in supply , illustrated by a leftward shift PABT S2 S1 P Leftward shift--moving towards zero at every price 0 Q2 Q1 QABT
Determinants of Supply Example 3. Technological Improvements Better handling purse-seine nets in SABT 4. Price of Complements in Production Supply of PWhalebonedue to:
Determinants of Supply Example 5. Price of Substitutes in Production Supply of P of
Market for Atlantic Bluefin Tuna, 1995 E = Market Equilibrium S1995 no pressure to ∆ because buyers and sellers are Pe95 D1995 Qe95 Quantity (millions of lbs per year)
In 1998, the Japanese economy “tanked” due to the Asian financial crisis, reducing the amount that wholesalers were willing to pay for Atlantic bluefin tuna (Boston Business Journal, September 11, 1998). Illustrate the effect on the market for ABT, assuming that the demand for ABT fell by 60 million lbs due to the Asian financial crisis.
Market for Atlantic Bluefin Tuna, 1995-1998 DABT by 60 million lbs per year Event: Asian Crisis S1995= S1998 60 Pe95 Pe98 D1998 D1995 Qe98 Qe95 Quantity (millions of lbs per year)
Over the 18 months from January 2006 to June 2007, people in Russia, South Korea and China developed a taste for sushi and dozens of countries reduced their catches of bluefin tuna by 20 percent to stabilize the bluefin tuna population. These two events caused an increase in the quantity of bluefin tuna demanded and a decrease in the quantity of bluefin tuna supplied. an increase in the quantity of bluefin tuna demanded and a decrease in the supply of bluefin tuna. an increase in the demand for bluefin tuna and a decrease in the quantity of bluefin tuna supplied. an increase in the demand for bluefin tuna and a decrease in the supply of bluefin tuna.
2. The effect of these events on the market for bluefin tuna is best illustrated by Price ($ per lb) Price ($ per lb) (a) (b) SJan06 SJan06 SJune07 SJune07 20% 20% PJune07 PJune07 $130 $13 PJan06 PJan06 DJune07 DJune07 DJan06 DJan06 Quantity QJune07 QJan06 Quantity QJune07 QJan06 Price ($ per lb) Price ($ per lb) (c) (d) SJan06 SJan06 SJune07 SJune07 20% PJune07 PJune07 $130 $13 PJan06 PJan06 DJune07 DJune07 20% 20% DJan06 DJan06 Quantity QJune07 QJan06 Quantity QJune07 QJan06
“Since the start of last year, the average price of imported frozen northern and Pacific bluefin has risen more than a third, to $13 a pound, according to Japan's Fisheries Agency.”. ─“Japan Adapts to Tuna Shortage: Waiter, There's Deer in My Sushi,” The New York Times, June 25, 2007
3. The effect of these events on the market for avocadoes is best illustrated by Price SJune07 Price SJan06 SJan06 SJune07 (a) (b) PJan06 PJune07 PJune07 PJan06 = DJune07 DJan06 DJan06 QJan06 QJune07 Quantity QJune07 QJan06 Quantity Price Price = SJan06 SJune07 SJan06 (c) (d) SJune07 PJune07 PJune07 DJune07 PJan06 PJan06 DJune07 DJan06 DJan06 QJune07 QJan06 Quantity QJune07 QJan06 Quantity
Pale skin Conquering Scurvy in the 18th Century Sunken Eyes Connective tissue disease: body becomes “unglued” Loss of teeth In 1747, Lind ran an experiment on the sailors of the HMS Salisbury Sick Sailors James Lind Limes Other Common Treatments Recovered Quickly Got Sicker
Market for Limes, 1794 - 1796 In 1795, the Royal Navy ordered sailors be given lime or lemon juice daily, causing them to be nicknamed limeys. PLIMES D1796 S1794 = S1796 D1794 T :quantity supplied P96 R T R: quantity demanded P94 Shortage Buyers Sellers Q94 =QS Q96 QD QLIMES
Buyers & Sellers P = Pe QD= QS Bid up P < Pe Shortage QS & Buyers Price QD
In 1747, the surgeon of the HMS Salisbury, James Lind, divided sailors sick with scurvy into groups, one of which was given limes to eat, another was given nutmeg and a third drank apple cider. Lind found that only limes were effective at treating scurvy. limes cured the disease but apple cider slightly improved the sailors’ health. limes cured the disease but nutmeg slightly improved sailors’ health. limes cured the disease but both apple cider and nutmeg slightly improved sailors’ health.
James Lind later developed a method of preserving lime juice for use at sea. discovered that scurvy was due to a deficiency of vitamin A, which is provided by limes. died of scurvy on a long voyage that ran out of lime juice. discovered that cholera was a waterborne disease.
Mother of Pearl Shells and World War I In the early years of the 20th Century, the inner shell of sea oysters—called Mother-of-Pearl (MOP)—was used to create shirt buttons and to decorate jewelry boxes, revolvers and walking canes. Nearly all MOP was harvested off the coast of Australia by hundreds of oyster diving companies using boats called luggers. Suppose the market for MOP reached long-run equilibrium in 1913. In 1914, soldiers marched off to war confident that they would be home by Christmas. Few people anticipated the stalemate that would be created by trench warfare. As the war dragged on, fewer and fewer people wanted (and/or could afford) fancy buttons, walking sticks and jewelry boxes made of MOP. “By 1918, the price of mother-of-peral was so low that there seemed little point in sending the luggers out to sea” (The White Divers of Broome, p. 292).
Market for MOP Shells, 1913-1918 PMOP S1913 P1913 D1913 Q1913 QMOP
Market for MOP Shells, 1913-1918 PMOP S1913 =S1918 P1913 P1918 D1913 D1918 Q1913 Q1918 QMOP
Market for MOP Shells, 1913-1918 PMOP S1913 =S1918 P1913 P’ P1918 D1913 D1918 Q1913 Q1918 QMOP Immediately after ↓D, P= P’ Adjustment Process: → Shortage of A B arises
Market for MOP Shells, 1913-1918 PMOP S1913 =S1918 A B P1913 P’ P1918 D1913 D1918 Q1913 Q1918 Q1918 = Qs at P’ QMOP Qd at P’ Immediately after ↓D, P= P’ Adjustment Process: → Surplus of A B arises → → ↑QD & ↓QS until new equilibrium is reached ↓P
Tri-State Crematory (TSC) Scandal Two Events in 2002: Tennessee 200 decomposing bodies discovered at TSC Alabama GA “reformed” law by requiring crematories to hire embalmers “Government Six Feet Under”
Market for Cremations 2001-2002 Predicted Outcome PC Δ P Δ Q S2002 ? S2001 P2001 D2001 GA law SC D2002 TSC DC Scandal Q2002 Q2001 QC