Download
1 / 12
130 likes | 278 Vues
Introduction to Engineering Linear & Logarithmic Scales. Agenda Linear & Logarithmic Scales Linear vs. Linear Plot Log-Log Plot Semi-log (log v. linear) plot. Working With Data. Engineers often collect large amounts of data Two common ways to analyze the data are:

E N D
Introduction to EngineeringLinear & Logarithmic Scales Agenda Linear & Logarithmic Scales Linear vs. Linear Plot Log-Log Plot Semi-log (log v. linear) plot
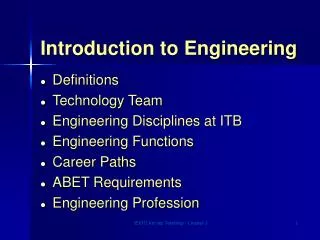
Working With Data • Engineers often collect large amounts of data • Two common ways to analyze the data are: • Write an equation to fit the data. • Graph the data.
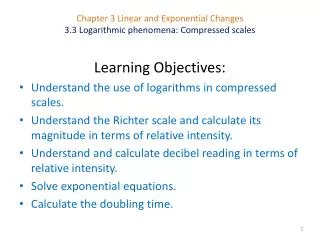
Working with Equations Describing Engineering Phenomena and Data • Plotting data with appropriate scales can be very helpful in display of data and interpretation • Choosing the right scale can make the appear on a straight line • Choosing the right scale allows you to plot data ranging over several orders of magnitude on a single page.
-20 -15 -10 -5 0 5 10 15 20 0.1 1 10 100 Linear and Logarithmic Scaling Linear axis: Logarithmic axis:
Three Examples • Temperature Expansion • Linear Y = mX + B • Wind Force • Power Equation Y = bXm • Population Growth • Y = bemX
Length, L a L 1 Lo dT Linear Relationship Example Temperature Expansion of Pipe L = a (T – To) + Lo L = a (dT) + Lo (Form : Y = mX + b)
Power Relationship ExampleWind Force on Road Sign • Wind Force on a Sign F = P A • P = 0.0036 V2 • F = 0.0036 V2 A • Where • P = pressure in lb/ft2 • V = velocity in ft/sec • (Form Y = bXm)
Exponential Relationship ExamplePopulationGrowth Y = bemX Linear Form: ln Y = ln b + m XY* = m X + b
Assignment • Assignment #8 • Log and Semi-Log Review sheet • Bring a floppy disk to class tomorrow