Download
1 / 32
600 likes | 1.24k Vues
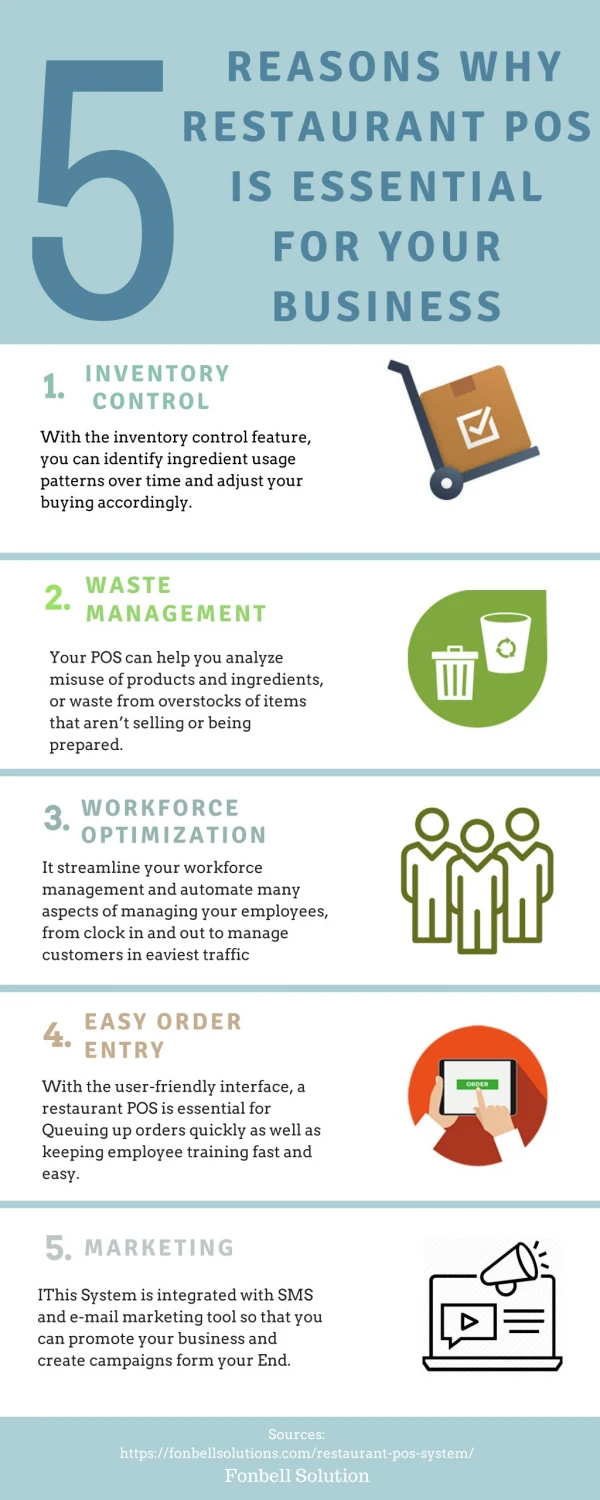
Why Strategic Cost Management is Essential for Your Hospital. Presentation document. May 15, 2014. CONFIDENTIAL AND PROPRIETARY Any use of this material without specific permission of McKinsey & Company is strictly prohibited. Global, cross industry insights.

E N D
Why Strategic Cost Management is Essential for Your Hospital Presentation document May 15, 2014 CONFIDENTIAL AND PROPRIETARY Any use of this material without specific permission of McKinsey & Company is strictly prohibited
Global, cross industry insights • Founded in 1926, 94 offices in 55 countries • 20 industry sectors and 7 functional practices • Serve 94% of 100 leading global corporations, and 75% of top 100 US companies • Depth of provider expertise • Over 300 engagements for ~100 providers in past 5 years, e.g., • 7 of the 10 largest U.S. hospital systems • 9 leading AMCs and 5 leading children’s hospitals • Dozens of independent hospitals and small systems • US Health Reform Center founded by former special assistant to President Breadth across health care chain • Serve 9 of the 10 largest managed care firms • Governments and health systems in 17 countries and 5 US states • 19 of the top 20 global Pharma, biotech, and device companies • Foundations, multilaterals, and NGOs in global public health McKinsey is one of the leading global management consulting firms, with deep experience serving providers and the healthcare industry
Objective Health is a specialized group within McKinsey, focused on advanced analytics to help health systems make better decisions and achieve sustainable results • Specialized group within McKinsey & Company that uses advisory expertise, advanced analytics, and tools to empower hospitals to improve, survive, and thrive • We provide a unique approach utilizing proprietary healthcare analytics, detailed benchmarks, and extensive hospital expertise to quickly identify and seize the right opportunities • Hospital-specific tools and services help your organization initiate, track, and sustain long-term results Global Healthcare Practice Healthcare Systems & Services
Contents • Why is strategic cost management important? • Case study: 500 bed health network
Global trend in healthcare <10 Healthcare cost is trending further upward globally 10-15 >15 Share of healthcare costs as part of GDP%1 Country 2008 2015 2020 2025 2030 Korea 5.9 6.7 7.4 8.1 8.9 Hong Kong 6.0 6.8 7.5 8.2 9.0 Spain 7.8 8.9 9.7 10.7 11.7 Italy 8.8 10.0 11.0 12.0 13.2 U.K. 9.3 10.6 11.6 12.7 14.0 Australia 10.5 10.5 13.1 14.4 15.8 Canada 10.8 12.3 13.5 14.8 16.2 Germany 10.8 12.3 13.5 14.8 16.2 France 11.2 12.7 14.0 15.3 16.8 U.S. 16.1 18.3 20.1 22.0 24.2 1 Assumptions: GDP growth of 2% (OECD-Prognosis, 2000-50). Healthcare spending increases 1.9 basis points faster (OECD historical rate) SOURCES: OECD Policy Implications of the New Economy – 2000-50, 2001; Global Insight WMM, 2000-37; Espicom: World Pharmaceutical Fact Book, 2008; International Monetary Fund; World Economic Outlook Database, October 2009; McKinsey
Historical cost growth Operating expenses have grown consistently in recent years and the pace of growth is expected to continue to outpace inflation Operating expenses per AA $ per AA • Represents 10% increase over 2008 rates • 3.4% higher than inflation over same time period • +2% p.a. • +4%p.a. • +3%p.a. • +2%p.a. • +1%p.a. • 2008 • 09 • 10 • 11 • 12 • 2013 Source: Publicly reported provider financials (includes CYH, HCA, HMA, LPNT, THC,UHS); www.usinflationcalculator.com/inflation/current-inflation-rates
Payor mix advantage of larger systems Larger systems tend to have a better payor mix, with a higher percentage of commercially insured patients Payor mix Non-government insured patient days as a percent of total patient days, n =1757 • Larger systems have done a better job of attracting commercially-insured patients • A larger proportion of favorable commercial payments results in increased operating margin 0-50 50-100 100-300 300-500 500-1000 1000-1500 1500+ System net revenue ($M) Source: CMS cost reports; OH analysis, 2009 data
Cost performance by size Larger systems have higher margins despite mediocre cost performance, as they spend less of each dollar of revenue Cost performance as a percent of net revenue Administrative and clinical cost as a percent of net revenue1,2 45 Average clinical cost Average administrative cost 40 35 • Overall cost as a percentage of net revenue decreases as scale increases despite poorer absolute cost performance 30 25 20 15 0-50 50-100 100-300 300-500 500- 000 1000-1500 1500+ System net revenue ($M) 1 Included costs are all administrative costs as well as clinical costs attributed to the following departments: adults and pediatrics, radiology, laboratory, operating room, respiratory therapy, emergency, medical supplied and drugs charged to patients, physical therapy, ICU, pharmacy, and ECG. Administrative and clinical costs are NOT wage index- and CMI-adjusted. 2 For administrative cost percentage of net revenue, n=1200. For clinical cost percentage of net revenue, n =586, 2009 data Source: CMS cost reports; OH analysis
Why size is relevant As a result, larger hospital systems tend to have better margins Median operating revenue by rating Median operating margin by rating USD, Millions Percent ‘AA’ ‘AA’ ‘AA−’ ‘AA−’ ‘A+’ ‘A+’ ‘A’ ‘A’ ‘A−’ ‘A−’ ‘BBB+’ ‘BBB+’ ‘BBB’ ‘BBB’ ‘BBB−’ ‘BBB−’ Source: Fitch report on non-profit hospitals, 2011; Kaufman & Hall
Drivers of performance Governance and strategy are the two most important factors for assessing a hospital’s continued success • Drivers of performance • Observed performance • High quality management team • Stable and experienced • Record of predictable and strong performance • Competent and experienced board of directors • Governance • Profitability 3 1 • Strategy • Clearly articulated strategy to succeed in its market, including: • Clinical service line strategy • Regional/ market strategyPerspectiveon how hospital will participate in new business models/partnerships • Physician alignment/ partnership strategy • Cost management • Liquidity and leverage 4 2
Cost vs NR/AA Meanwhile NR/AA has been flat and actually declined in over the past few years • NR/AA • Op Ex Financials per AA $ per AA CAGR1 2008–13 • 0% • 2% • 2008 • 09 • 10 • 11 • 12 • 2013 1 Compound annual growth rate. Source: Publicly reported provider financials (includes CYH, HCA, HMA, LPNT, THC,UHS); www.usinflationcalculator.com/inflation/current-inflation-rates
Providers are responding in a variety of ways – five are particularly common Focus of case study • Enacting broad-ranging cost control programs, including lean operations, back-office cost control & clinical transformation (“Medicare margin” efforts) 1 • Engaging in a frenetic wave of transactions (M&A) across the for-profit, not-for-profit, and outpatient-focused spectrum 2 • Continuing to invest heavily in services & specialists with differential reimbursement & margin (leading to “tragedy of the commons” in places) 3 • Continuing to move towards greater physician alignment through structural options (employment and “employment-like” in strong CPOM1states) 4 • Considering innovative incentive relationships (e.g., ACO-like or “Clinical Integration”), but cautious of appropriate strategic & business model rationale 5
“Payor-led” integrated network • Payor-led affiliation or acquisition of health system which seeks full clinical and operational integration to reduce costs, improve member experience, and manage referral volume • “Provider-led” integrated network • Provider system builds a health-plan, leveraging brand name to drive volume to provider system • ACO • An organization of health care providers accountable for quality, cost, and overall care; share cost savings if performance metrics are met • Episodes of care • Covers all aspects of preadmission, inpatient, and follow-up care, including postoperative complications within a set time period for procedures, e.g., hip replacement • Patient centered medical home • Pay for value • Team of physicians and extenders, coordinated by a PCP, coordinate provide high levels of coordinated care; typically tied to P4P contract • Payment bonus tied to efficiency metrics (e.g., reduction in ER visits, imaging) • “Basic P4P” • Payment upside based on performance metrics linked to value creation (e.g. BCSMA Alternative Quality Contract / AQC) High degree of experimentation with a variety of new reimbursement and risk-sharing models… • Select examples • Description • Full risk • Both upside and downside risk • Risk sharing • Gain sharing • Exclusively upside opportunity • Incentive payment
Failure typically comes about in one of three areas of a transformation…. Business results • Failure to sustain • No change in day-to-day behaviors • Change agents – not the line – leading the change • No capability upgrade at the site level • Improvements not baked into budgets • Failure to scale • Multiple bottom-up efforts with competing methodologies and no overarching blueprint • Limited leadership capacity • Waning focus from senior team • Failure to launch • Stuck in diagnostics – leaders unable to align on what to do, where to start • Managers not held accountable for performance • Employees resistant People involved 10s 100s 1,000s Time 1-3 years
…and stems largely from non-technical factors … mainly because organizational health gets in the way 70% of change programs fail … Other obstacles 14 Inadequate resources or budget 14 % of efforts failing to achieve target impact Management behavior does not support change 33 30 70 Organizational Health factors Employee resistance to change 39 Source: Scott Keller and Colin Price, Beyond Performance: How Great Organizations Build Ultimate Competitive Advantage. 2011
An organizations performance and health are equally important to sustain and build long term success • Performance • Health • How an organization • aligns itself, executes with excellence, and renews itself to sustainably achieve performance aspirations • What an enterprise delivers to stakeholders in clinical, financial, and operational results SOURCE: McKinsey & Company, Objective Health
Sustainable operational improvement requires focus on 3 interrelated components of change • 3 components are mutually reinforcing and overlapping, which leads to sustained improvements in performance • Improves the end-to-end configuration of material and staff to eliminate waste and bring value to the patient • Management systems • Operating system • Operating system • Installs performance reporting system for management of the operating system and daily performance discussions • Management systems • Changes way people think, feel, and conduct themselves in the workplace, both individually and collectively • Mindsets, • Behaviors, and Capabilities • Mindsets, Behaviors, and Capabilities
e MANAGEMENT INFRASTRUCTURE A rigorous performance management system needs to be adopted to ensure the improvements identified will stick Lever Best practices Clear targets & accountability • Business directions and strategic goals need to be translated into top-level key performance indicators (KPIs) • KPIs must cascade effectively throughout the organization • Simple, measurable, achievable, results-oriented and timely goals are agreed upon throughout the planning process a Right performance tracking • Ensure performance tracking with IT tools/data management processes are available to support tracking and measuring of KPIs • Easy–to-access performance reports are available to monitor KPIs b • Regular sequences of performance review meetings are established to track progress and review results • Clear agendas and action items are established for each performance review meeting Effective review meetings c Reward & recognition • Encourage open recognition of good performance • Conduct coaching and two-way feedback discussions regularly d
MINDSETS AND BEHAVIORS The McKinsey influence model is a proven tool for managing change within an organization • 1 • 2 • Role modeling • “I see my leaders, colleagues, and staff behaving differently” • Understanding • & commitment • “I know what is expected of me – I agree with it, and it is meaningful” • Senior leader/ senior team • Symbolic acts • Influence leaders • Change story • On-going, two-way communications • Language and rituals “I chooseto change my mindset and behavior if …” • 3 • 4 • Skills required for change • “I have the skills and opportunities to behave in the new way” • Reinforcement mechanisms • “Barriers are being removed and I’m being rewarded for making the changes I am being asked to make” • Refreshing the talent pool • Technical and relational skills • Field and forum • Structure • Systems • Processes • Incentives SOURCE: McKinsey & Company
Correlation of Organizational Health and performance gap at a public healthcare system Organization level Department level The healthiest organizations and business units tend to financially and operationally outperform less healthy organizations Empirical research has proven that organizational performance and health are mutually reinforcing drivers • Average Total Return to Shareholders by health quartile (9 year average) TRS over time Org Health1 High R2 = 0.50 • Top quartile Performance • Middle quartiles • 3x Low • Bottom quartile Weak Strong Health 3X greater TRS – ~$1.2B in value for the average company in our dataset 1 As defined by Organizational Health Index score; n = 272 SOURCE: McKinsey Organization Practice / OHI Solution
Contents • Why is strategic cost management important? • Case study: 500 bed health network
McKinsey approach • Operationalize the strategy • Develop strategy and specific initiatives • Diagnose performance and culture Performance & culture 3 Where To focus? 1 4 2 How to play? Impact 5 Feasibility Develop a clear picture of the situation today, both internally and externally (e.g. reform, regional trends) on performance Diagnose and develop momentum opportunities, market portfolio changes and organizational readiness Identify initiatives needed to capture opportunities Prioritize initiatives that drive the most value and develop overall value proposition Create an actionable plan and identify organizational enablers to support it
In the near-term, CLIENT should choose a few priority practices for focus that have high potential impact and make sense for strategic goal Highest potential practices Potential impact Degree of ‘fit’ for CLIENT Drives broken outcome? Fixes broken practice? Aligns with archetype? “Top 10” value desired by employees? “Top 10” interview theme? High-potential practices for focus in next 6-9 months • Role Clarity • Operational management • Process-based capabilities • Financial management • Supportive Leadership • Strategic clarity • Top-down innovation • Knowledge sharing • Talent acquisition • Talent development • Personal Ownership • Risk management • Employee involvement • Performance contracts • Authoritative leadership • Internally competitive • Consultative leadership • Challenging leadership Source: CLIENT OHISurvey, overall (n=88)
In order to fulfill the mission and vision of the organization, the client focused on execution in six primary areas Green = Leading the competition Yellow = Falling behind our competition Red = Outlier in the market Strategies Initiatives for success • Redefine enterprise operating model • Realign executive and clinical structure • Develop talent across the enterprise • Align governance (PAC, MEC, SL & PIC) • Realign approach to physician structure • Lead in clinical excellence • Support performance improvement with robust measurement • Coordinate care across the enterprise • Enhance research and education • Reduce clinical variation w/ evidence based approach • Lead in patient experience • Expand patient & family experience beyond our walls • Engage patients through technology including telemedicine • Expand convenience and choice through network reach • Realign approach to physician recruitment & development • Define geographic portals to support service line growth • Extend network reach • Explore partnerships and affiliations • Revisit marketing approach • Improve operational efficiency • Enhance throughput & capacity • Improve labor productivity • Define, align and integrate data Infrastructure • Optimize revenue cycle and supply chain • Shift to fee-for-value • Evaluate bundled payment models for the market • Cultivate development to offset declining reimbursement • Transition into population health SOURCE: Source
Client focused on more than just lean principles, taking on physician preference and behavior related initiatives • Largest national system • Reducing clinical variability through evidence-based care pathways and order sets • National systems • Improving utilization of physician preference supplies by adopting evidence-based practices CLIENT FOCUS • Medium-sized regional system • Applying Lean principles to improve patient flow in the ED, OR, and inpatient floors • Small local system • In early stages of identifying opportunities to improve patient throughput
The operational excellence assessment has identified $43M - $70M in savings opportunities to date • CLIENT DATA • Potential impact (annual)1 • $ Millions • Opportunity areas • Description • Provides enhancement of role clarity, accountability, and ability to execute strategic and operational objectives • Span of Control • No savings • Opportunities for improvements in clinical and non-clinical departments, as well as in overall workforce policies • Hospital Labor Productivity • 14.9 - 13.3 • Majority of opportunity in reducing excess length of stay across all floors • Smaller opportunities in ED and OR efficiency • Throughput and Capacity • 12.4 - 23.2 • Opportunity within each service lines for improvement • Majority of opportunity in high cost supplies • Clinical Variation • 4.4 - 8.8 • Many physician practices losing money beyond median benchmark; comp relative to productivity and staff expenses driving loss • Practice Benchmarking • 5.5 - 15.0 • Performs well today, but can improve with focus on cash collections and denials • Revenue Cycle management • 3.8 - 6.7 • Opportunities predominately around managing physician utilization of preference items • Purchasing and Supplies • 1.2 - 3.1 • Total • 42.7 - 70.1
Framework for improving Operational Efficiency Improve Operational Efficiency to drive value proposition Exec Sponsor: Chris Hospital Labor Productivity Executive Sponsor – Chris & Dr. Rick Business Lead – Jamie Throughput & Capacity Executive Sponsor –Jason & Dr. Mike Business Lead – Ron Practice Benchmarking Executive Sponsor –Dr. Joe & Dr. John Business Lead – Rob Span of Control Executive Sponsor – Mike & Dr. Rick Business Lead – Casey Data Management and Governance Executive Sponsor – Peter & Dr. Joe Business Lead – Tina Purchasing & Supplies Executive Sponsor – Dr. Ian & Dr. Fred Business Lead – Michael & Herb Clinical Variation Executive Sponsor – Dr. Mike Business Lead – Rob Revenue Cycle Management Executive Sponsor – Jamie Business Lead – Tina • Deliverables: • Set clear objectives and measurement • Set timelines for completion
A team charter should be refined to ensure that there is a clear picture on goals, responsibilities and timelines • Mission statement and scope • Priority actions • Reduce variation in high cost supplies across OR and cath lab • Mission: Reducing clinical variation across all providers to improve clinical quality and reduce cost • Update preference cards • Scope: All credentialed physicians • Improve current blood trans-fusion management to reduce unnecessary utilization • Team leader and members • Deliverables and key dates • Target outcomes and metrics • Role • Assigned • Deliverable • Due date • Metric • Target/baseline • Supply cost per case by DRG • Depends on DRG • Jan 13 • 2013 expected capture by service line • Executive champion: • Chris • Accountable leader • Dr. Mike • Lab/imaging/blood per case DRG • Depends on DRG • Responsible individuals • TBD • TBD • TBD • Average length of stay by DRG • GMLOS • Consult • TBD • Total estimated $ impact at maturity • $4.4-8.8MM • Inform • TBD • Resources required • Notes • Service line Executive directors • Clinical analyst team • Capitol required: N/A • Each Medical director to sign off on amount of variation to be removed in fiscal 2013
1 • 2 • Role modeling • Understanding • & commitment • 3 • 4 • Skills required for change • Reinforce-ment mechanisms Exercise: Where are our greatest challenges… (CLIENT RESPONSES) • Personnel (having the right leaders) • Equal accountability • Access to leadership • Physician role clarity • “We vs. They” mentality • Sense of entitlement • Physician role clarity/expectations • Sense of team (clinical vs. non-clinical) • Breaking out of individual silos • Access to data/benchmarking tools • Team members becoming comfortable with the data • Understanding the “end game”/larger picture; downstream impact • Focus on the “reason” • Creating the message to get the staff onboard with initiative • Facilitate two-way communication • Transparency around both good and bad news • Inadequate training • Understanding that management can be effective even without technical expertise • Leadership skills • Building on individual strengths • Establishing the workforce/process in place to drive success • Anticipating turnover • Prioritization of initiatives • Equal accountability • Lack of performance management system SOURCE: Moffitt progress review workshop
1 • 2 • Role modeling • Understanding • & commitment • 3 • 4 • Skills required for change • Reinforce-ment mechanisms Exercise: What can be done to improve… (CLIENT RESPONSES) • Selecting/recruiting the right leaders • Focused leadership retreat • Role clarity • Building/developing trust • “Trusting team members to make the right decision” • Being able to make decisions without having multiple meetings ü • Ranking of skills • Time management/productivity • Spending and using time effectively (e.g., re-evaluating the necessity of meetings) • Institutional prioritization • Formalization of data review process • Developing accountability • Strive for excellence, instead of settling for mediocrity SOURCE: Moffitt progress review workshop
Refine overarching ‘org design’ (e.g., overall structure, cross-cutting management processes) to align with strategy and key health practices Strategic clarity Role clarity Operational management Process-based capabilities Invest in leadership development to build key capabilities Performance contracts People performance reviews Talent acquisition Talent development Savings of $15 million achieved in FY13 over baseline projections “Communication has been the key to success, focusing on cost management to ensure our commitment to providing exceptional outcomes and patient experience Deep dive diagnostic Across all functions to benchmark current performance and identify key opportunity areas Identification of key opportunities Focus on productivity, patient throughput, and clinical variation Implementation design Created end-to-end implementation plan Centralized project management office to manage full scope of analysis Developed robust central analytics group to support on-going analysis Implementation plan to capture full 10-15% savings within 2 years of launch As part of the strategy to step up its clinical and operational effectiveness and efficiency, a large provider system is transforming all areas of its operations Focused on maintaining clinical excellence across all services History of overcoming adversary (split from former alliance) Finance not viewed as strategic business partner “Quality care at all costs” mentality pervades client Key objectives of the transformation effort Develop best-in-class efficiency levels Actively engage physicians (employed and non-employed) Achieve 10-15% savings (NR) McKinsey approach Client impact Client situation Case study – Transformation effort led to significant effective-ness and efficiency gains 2012ACFO37 • Financial Planning & Target • Setting SOURCE: McKinsey
Next steps • Question or comments? • Please contact: • branden_neal@mckinsey.com