Download
1 / 16
850 likes | 2.21k Vues
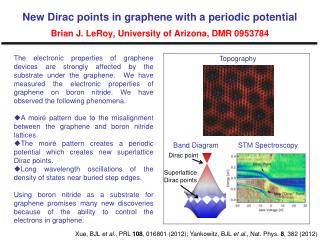
Topography. The Art of Reading & Using Contour Maps. What is a Topographic Map?. Earth's surface shape shown by contour lines Contour lines - lines connecting points of equal elevation measure mountain height, ocean depths, slope steepness Allows planning for – parks hiking/riding

E N D
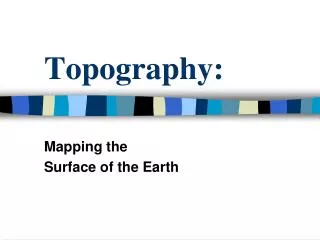
Topography The Art of Reading & Using Contour Maps
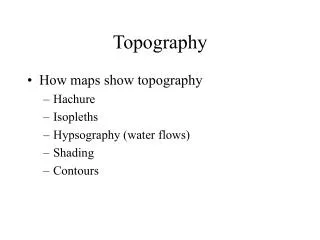
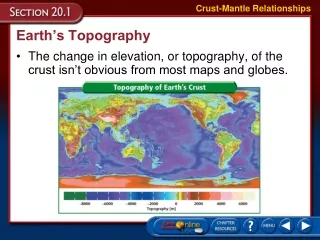
What is a Topographic Map? • Earth's surface shape shown by contour lines • Contour lines - lines connecting points of equal elevation • measure mountain height, ocean depths, slope steepness • Allows planning for – • parks • hiking/riding • building/construction • drainage
Reading Topographic Maps • Contours – lines of different widths • Contours never cross • Used to determine elevations – index contours are wider • Elevations printed along index contours • Narrower contours found between index contours – help show more details of land surface
Reading Topographic Maps (continued) • Contours close together = steep slopes • Widely spaced contours = fairly level/flat ground slope relatively level • contour interval = elevation difference between adjacent contour lines
Index Contour (Elevation = 200’) Index Contour (Elevation = 100’) Every 5 lines: (200-100)/5 = 20’ Therefore, contour interval = 20’
What Does It All Mean? • The more contour lines packed closely together represent steep, cliff-like areas
What Does It All Mean? • The more two contour lines are spread apart, the flatter the area
What Does It All Mean? • Contour lines that form a mountain-like shape show where water has cut a path (valley)
13,800 • What is the contour interval? • What is the elevation of Mt. Rainer? • Describe the circled area. • Describe this circled area. X 14,000 – 13,800 = 200 200 / 5 lines = 40’ 14,000
What is the average elevations for houses 3, 4, and 5 to the nearest tenth of a meter? 112 Contour Interval = 3 m . . 9 7 3 . 82
Predictions • How might this area’s landform change over time?
Remember… • Topographic maps can help you find elevations, Trails, and Places to climb • Topographic maps show you the “lay of the land” (landforms) by connecting points of equal elevation • Index contour lines are darker and have an elevation associated with it • The ‘Contour Interval’ is the elevation distance between two adjacent lines • Scales are usually shown in inches or feet
Mt. Capulin Capulin Volcano National Monument, located in northeastern New Mexico, was designated a U.S. National Monument on August 9, 1916. It is a well-preserved, relatively young (58,000 to 62,000 years old), symmetrical cinder cone. It rises steeply from the surrounding grassland plains to an elevation of 8,182 feet above sea level. The irregular rim of the crater is about a mile in circumference and the crater about 400 feet deep.