Download
1 / 44
450 likes | 584 Vues
1 Measuring Macroeconomic Activity: An Overview. At various points in the circular flow of payments , economic activity is measured and recorded in the national income and product accounts .

E N D
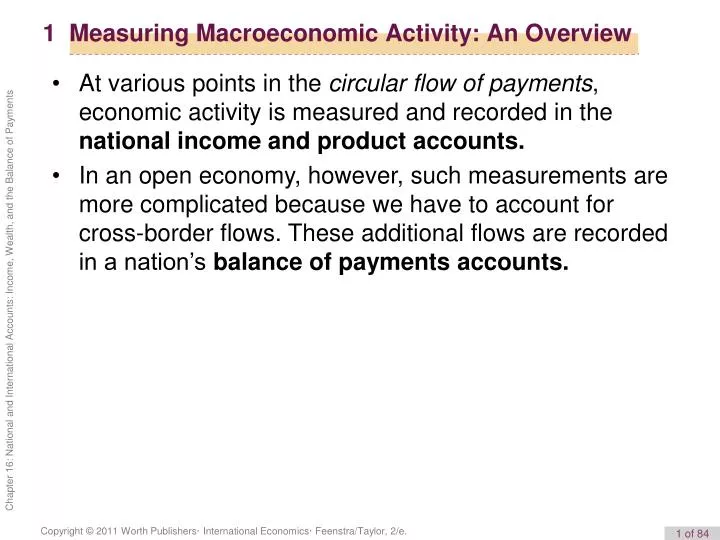
1 Measuring Macroeconomic Activity: An Overview • At various points in the circular flow of payments, economic activity is measured and recorded in the national income and product accounts. • In an open economy, however, such measurements are more complicated because we have to account for cross-border flows. These additional flows are recorded in a nation’s balance of payments accounts.
1 Measuring Macroeconomic Activity: An Overview The Flow of Payments in a Closed Economy: Introducing the National Income and Product Accounts • Gross national expenditure (GNE) is the total expenditure on final goods and services by home entities in any given period (C + I + G). • Acountry’s gross domestic product (GDP) is the value of all (intermediate and final ) goods and services produced as output by firms, minus the value of all goods and services purchased as inputs by firms. • GDP is a product measure, in contrast to GNE, which is an income measure. • In a closed economy, income is paid to domestic entities. It thus equals the total income resources of the economy, also known as gross national income (GNI).
1 Measuring Macroeconomic Activity: An Overview FIGURE16-1 The Closed Economy Measurements of national expenditure, product, and income are recorded in the national income and product accounts, with the major categories shown. The purple line shows the circular flow of all transactions in a closed economy.
1 Measuring Macroeconomic Activity: An Overview The Flow of Payments in an Open Economy: Incorporating the Balance of Payments Accounts • The difference between payments made for imports and payments received for exports is called the trade balance (TB), and it equals net payments to domestic firms due to trade. GNE plus TB equals GDP, the total value of production in the home economy.
1 Measuring Macroeconomic Activity: An Overview The Flow of Payments in an Open Economy: Incorporating the Balance of Payments Accounts • The value of factor service exports minus factor service imports is known as net factor income from abroad (NFIA), and thus GDP plus NFIA equals GNI, the total income earned by domestic entities from all sources, domestic and foreign.
1 Measuring Macroeconomic Activity: An Overview The Flow of Payments in an Open Economy: Incorporating the Balance of Payments Accounts • Gifts may take the form of income transfers or “in kind” transfers of goods and services. They are considered nonmarket transactions, and are referred to as unilateral transfers. • Net unilateral transfers (NUT) equals the value of unilateral transfers the country receives from the rest of the world minus those it gives to the rest of the world.
1 Measuring Macroeconomic Activity: An Overview The Flow of Payments in an Open Economy: Incorporating the Balance of Payments Accounts • These net transfers have to be added to GNI to calculate gross national disposable income (GNDI), and thus GNI plus NUT equals GNDI, which represents the total income resources available to the home country.
1 Measuring Macroeconomic Activity: An Overview The Flow of Payments in an Open Economy: Incorporating the Balance of Payments Accounts The current account (CA)is a tally of all international transactions in goods, services, and income (occurring through market transactions or transfers).
1 Measuring Macroeconomic Activity: An Overview The Flow of Payments in an Open Economy: Incorporating the Balance of Payments Accounts • The value of asset exports minus asset imports is called the financial account (FA). These net asset exports are added to home GNDI when calculating the total resources available for expenditure in the home country.
1 Measuring Macroeconomic Activity: An Overview The Flow of Payments in an Open Economy: Incorporating the Balance of Payments Accounts • A country may not only buy and sell assets but also transfer assets as gifts. Such asset transfers are measured by the capital account (KA), which is the value of capital transfers from the rest of the world minus those to the rest of the world.
1 Measuring Macroeconomic Activity: An Overview FIGURE16-2 The Open Economy Measurements of national expenditure, product, and income are recorded in the national income and product accounts, with the major categories shown on the left. Measurements of international transactions are recorded in the balance of payments accounts, with the major categories shown on the right. The purple line shows the flow of transactions within the home economy. The green lines show all cross-border transactions.
2 Income, Product, and Expenditure Three Approaches to Measuring Economic Activity ■ The expenditure approach looks at the demand for goods: it examines how much is spent on demand for final goods and services. The key measure is GNE. ■ The product approach looks at the supply of goods: it measures the value of all goods and services produced as output minus the value of goods used as inputs in production. The key measure is GDP. ■ The income approach focuses on payments to owners of factors: it tracks the amount of income they receive. The key measures are gross national income GNI and gross national disposable income GNDI (which includes net transfers).
2 Income, Product, and Expenditure From GNE to GDP: Accounting for Trade in Goods and Services ■Personal consumption expenditures (usually called “consumption”) equal total spending by private households on final goods and services, including nondurable goods such as food, durable goods, and services. ■Gross private domestic investment (usually called “investment”) equals total spending by firms or households on final goods and services to make additions to the stock of capital. Investment includes construction of a new house or a new factory, the purchase of new equipment, and net increases in inventories of goods held by firms (i.e., unsold output).
2 Income, Product, and Expenditure From GNE to GDP: Accounting for Trade in Goods and Services ■Government consumption expenditures and gross investment (often called “government consumption”) equal spending by the public sector on final goods and services, including spending on public works, national defense, the police, and the civil service. It does not include any transfer payments or income redistributions, such as Social Security or unemployment insurance payments—these are not purchases of goods or services, just rearrangements of private spending power.
2 Income, Product, and Expenditure From GNE to GDP: Accounting for Trade in Goods and Services (16-1) This important formula for GDP says that gross domestic product is equal to gross national expenditure (GNE) plus the trade balance (TB). The trade balance, TB, is also often referred to as net exports. Because it is the net value of exports minus imports, it may be positive or negative. If TB > 0, exports are greater than imports and we say a country has a trade surplus. If TB < 0, imports are greater than exports and we say a country has a trade deficit.
2 Income, Product, and Expenditure From GDP to GNI: Accounting for Trade in Factor Services • Gross national income equals gross domestic product (GDP) plus net factor income from abroad (NFIA). (16-2)
2 Income, Product, and Expenditure From GNI to GNDI: Accounting for Transfers of Income If a country receives transfers worth UTINand gives transfers worth UTOUT, then its net unilateral transfers, NUT, are NUT= UTIN− UTOUT. Because this is a net amount, it may be positive or negative. Adding the impact of net unilateral transfers to gross national Income, we obtain a full measure of national income in an open economy, known as gross national disposable income (GNDI), henceforth denoted Y: (16-3)
2 Income, Product, and Expenditure What the National Economic Aggregates Tell Us • We can group the three cross-border terms into an umbrella term that is called the current account, CA: (16-4)
2 Income, Product, and Expenditure Understanding the Data for the National Economic Aggregates TABLE 16-1 U.S. Economic Aggregates in 2009 The table shows the computation of GDP, GNI, and GNDI in 2009 in billions of dollars using the components of gross national expenditure, the trade balance, international income payments, and unilateral transfers.
2 Income, Product, and Expenditure Some Recent Trends FIGURE16-5 U.S. Gross National Expenditure and Its Components, 1990–2009 The figure shows consumption (C), investment (I), and government purchases (G), in billions of dollars.
2 Income, Product, and Expenditure Some Recent Trends FIGURE16-6 U.S. Current Accounts and Its Components, 1990–2009The figure shows the trade balance (TB), net factor income from abroad (NFIA), and net unilateral transfers (NUT), in billions of dollars.
2 Income, Product, and Expenditure What the Current Account Tells Us (16-5) • This equation is the open-economy national income identity. It tells us that the current account represents the difference between national income Y (or GNDI) and gross national expenditure GNE (or C + I + G ). Hence: • GNDI is greater than GNE if and only if CA is positive, or in surplus. • GNDI is less than GNE if and only if CA is negative, or in deficit.
2 Income, Product, and Expenditure What the Current Account Tells Us • The current account is also the difference between national saving (S = Y − C − G) and investment: • This equation is called the current account identity even though it is just a rearrangement of the national income identity. Thus, • S is greater than I if and only if CA is positive, or in surplus. • S is less than I if and only if CA is negative, or in deficit. (16-6)
APPLICATION Global Imbalances FIGURE16-7 (1 of 2) Saving, Investment, and Current Account Trends: Industrial Countries The charts show saving, investment, and the current account as a percent of each subregion’s GDP for four groups of advanced countries. The United States has seen both saving and investment fall since 1980, but saving has fallen further than investment, opening up a large current account deficit approaching 6% of GDP in recent years. Japan’s experience is the opposite: investment fell further than saving, opening up a large current account surplus of about 3% to 5% of GDP.
Private and Public Saving • We define private saving as that part of after-tax private sector disposable income that is not devoted to private consumption C. Hence, private saving Spis • We define government saving as the difference between tax revenue T received by the government and government purchases G. Hence, government saving Sgequals • Private saving plus government saving equals total national saving, since (16-7) (16-8) (16-9)
Private and Public Saving FIGURE16-8 (1 of 2) Private and Public Saving Trends: Industrial Countries The chart shows private saving and the chart on the right public saving, both as a percent of GDP. Private saving has been declining in the industrial countries, especially in Japan (since the 1970s) and in the United States (since the 1980s). Private saving has been more stable in the Euro area and other countries.
Private and Public Saving FIGURE16-8 (2 of 2) Private and Public Saving Trends: Industrial Countries(continued) Public saving is clearly more volatile than private saving. Japan has been mostly in surplus and massively so in the late 1980s and early 1990s. The United States briefly ran a government surplus in the late 1990s but has now returned to a deficit position.
3 The Balance of Payments Accounting for Home and Foreign Assets • If we use superscripts “H” and “F” to denote home and foreign assets, we can break down the financial account as the sum of the net exports of each type of asset: • FA equals the additions to external liabilities (the home-owned assets moving into foreign ownership, net) minus the additions to external assets (the foreign-owned assets moving into home ownership, net). (16-11)
3 The Balance of Payments How the Balance of Payments Accounts Work: A Macroeconomic View • Recall that gross national disposable income is • In addition, the home economy can free up (or use up) resources in another way: by engaging in net sales (or purchases) of assets. We can calculate these extra resources using our previous definitions:
3 The Balance of Payments How the Balance of Payments Accounts Work: A Macroeconomic View • Adding the last two expressions, we arrive at the value of the total resources available to the home country for expenditure purposes. This total value must equal the total value of home expenditure on final goods and services, GNE: • We can cancel GNE from both sides of this expression to obtain the important result known as the balance of payments identity or BOP identity: (16-12)
3 The Balance of Payments How the Balance of Payments Accounts Work: A Microeconomic View • The components of the BOP identity allow us to see the details behind why the accounts must balance. • If an item has a plus sign, it is called a balance of payments credit or BOP credit. • If an item has a minus sign, it is called a balance of payments debit or BOP debit. (16-13)
3 The Balance of Payments How the Balance of Payments Accounts Work: A Microeconomic View • We have to understand one simple principle: every market transaction (whether for goods, services, factor services, or assets) has two parts. If party A engages in a transaction with a counterparty B, then A receives from B an item of a given value, and in return B receives from A an item of equal value.
3 The Balance of Payments Understanding the Data for the Balance of Payments Account TABLE 16-2 (1 of 3) The U.S. Balance of Payments in 2009 The table shows U.S. international transactions in 2009 in billions of dollars. Major categories are in bold type.
3 The Balance of Payments Understanding the Data for the Balance of Payments Account TABLE 16-2 (2 of 3) The U.S. Balance of Payments in 2009 (continued) The table shows U.S. international transactions in 2009 in billions of dollars. Major categories are in bold type.
3 The Balance of Payments Understanding the Data for the Balance of Payments Account TABLE 16-2 (3 of 3) The U.S. Balance of Payments in 2009 (continued) The table shows U.S. international transactions in 2009 in billions of dollars. Major categories are in bold type.
3 The Balance of Payments Understanding the Data for the Balance of Payments Account • A country that has a current account surplus is called a (net) lender. By the BOP identity, we know that it must have a deficit in its asset accounts, so like any lender, it is, on net, buying assets (acquiring IOUs from borrowers). For example, China is a large net lender. • A country that has a current account deficit is called a (net) borrower. By the BOP identity, we know that it must have a surplus in its asset accounts, so like any borrower, it is, on net, selling assets (issuing IOUs to lenders). As we can see, the United States is a large net borrower.
3 The Balance of Payments What the Balance of Payments Account Tells Us • The balance of payments accounts consist of the current account, which measures external imbalances in goods, services, factor services, and unilateral transfers. The financial and capital accounts measure asset trades. • Surpluses on the current account side must be offset by deficits on the asset side. Similarly, deficits on the current account must be offset by surpluses on the asset side. By telling us how current account imbalances are financed, the balance of payments makes the connection between a country’s income and spending decisions and the evolution of that country’s wealth.
4 External Wealth • Just as a household is better off with higher wealth, all else equal, so is a country. • We can calculate a home country’s “net worth” or external wealth with respect to the rest of the world (ROW) by adding up all of the home assets owned by ROW (foreigners’ claims against home) and then subtracting all of the ROW assets owned by the home country (home claims against foreigners). • In 2009, the United States had an external wealth of about –$2,866 billion. This made the United States the world’s biggest debtor in history.
4 External Wealth The Level of External Wealth • The level of a country’s external wealth (W) equals • A country’s level of external wealth is also called its net international investment position or net foreign assets. It is a stock measure, not a flow measure. • If W > 0, home is a net creditor country: external assets exceed external liabilities. • If W < 0, home is a net debtor country: external liabilities exceed external assets. (16-14)
4 External Wealth Changes in External Wealth • Adding up these two contributions to the change in external wealth (ΔW), we find • Since −FA = CA + KA, substituting this identity into Equation (16-15), we obtain (16-15) (16-16)
4 External Wealth Some Recent Trends • In the case of the United States, for the past three decades, the financial account has been almost always in surplus, reflecting a net export of assets to the rest of the world to pay for chronic current account deficits.
4 External Wealth What External Wealth Tells Us • External wealth data tell us the net credit or debit position of a country with respect to the rest of the world. • They include data on external assets (foreign assets owned by the home country) and external liabilities (home assets owned by foreigners). A creditor country has positive external wealth, a debtor country negative external wealth. • Countries with a current account surplus (deficit) must be net buyers (sellers) of assets. • An increase in a country’s external wealth results from • every net import of assets; conversely, a decrease in external wealth results from every net export of assets.
4 External Wealth What External Wealth Tells Us • In addition, countries can experience capital gains or losses on their external assets and liabilities that cause changes in external wealth. • All of these changes are summarized in the statement of a country’s net international investment position.