Download
1 / 47
470 likes | 581 Vues
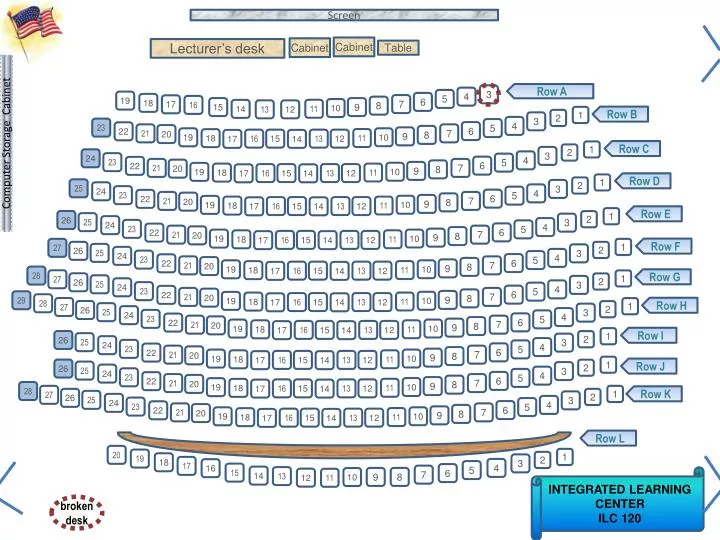
Screen. Cabinet. Cabinet. Lecturer’s desk. Table. Computer Storage Cabinet. Row A. 3. 4. 5. 19. 6. 18. 7. 17. 16. 8. 15. 9. 10. 11. 14. 13. 12. Row B. 1. 2. 3. 4. 23. 5. 6. 22. 21. 7. 20. 8. 9. 10. 19. 11. 18. 16. 15. 13. 12. 17. 14. Row C. 1. 2.

E N D
Screen Cabinet Cabinet Lecturer’s desk Table Computer Storage Cabinet Row A 3 4 5 19 6 18 7 17 16 8 15 9 10 11 14 13 12 Row B 1 2 3 4 23 5 6 22 21 7 20 8 9 10 19 11 18 16 15 13 12 17 14 Row C 1 2 3 24 4 23 5 6 22 21 7 20 8 9 10 19 11 18 16 15 13 12 17 14 Row D 1 2 25 3 24 4 23 5 6 22 21 7 20 8 9 10 19 11 18 16 15 13 12 17 14 Row E 1 26 2 25 3 24 4 23 5 6 22 21 7 20 8 9 10 19 11 18 16 15 13 12 17 14 Row F 27 1 26 2 25 3 24 4 23 5 6 22 21 7 20 8 9 10 19 11 18 16 15 13 12 17 14 28 Row G 27 1 26 2 25 3 24 4 23 5 6 22 21 7 20 8 9 29 10 19 11 18 16 15 13 12 17 14 28 Row H 27 1 26 2 25 3 24 4 23 5 6 22 21 7 20 8 9 10 19 11 18 16 15 13 12 17 14 Row I 1 26 2 25 3 24 4 23 5 6 22 21 7 20 8 9 10 19 11 18 16 15 13 12 17 14 1 Row J 26 2 25 3 24 4 23 5 6 22 21 7 20 8 9 10 19 11 18 16 15 13 12 17 14 28 27 1 Row K 26 2 25 3 24 4 23 5 6 22 21 7 20 8 9 10 19 11 18 16 15 13 12 17 14 Row L 20 1 19 2 18 3 17 4 16 5 15 6 7 14 13 INTEGRATED LEARNING CENTER ILC 120 9 8 10 12 11 broken desk
Please click in My last name starts with a letter somewhere between A. A – D B. E – L C. M – R D. S – Z Remember to hold onto homework until we have a chance to cover it
Introduction to Statistics for the Social SciencesSBS200, COMM200, GEOG200, PA200, POL200, SOC200Lecture Section 001, Spring, 2012Room 120 Integrated Learning Center (ILC)9:00 - 9:50 Mondays, Wednesdays & Fridays+ Lab Session. Welcome http://www.youtube.com/watch?v=oSQJP40PcGI
Use this as your study guide By the end of lecture today2/3/12 • Objectives of research in business • Characteristics of a distribution • Central Tendency • Dispersion • Shape • What are the three primary types of “measures of central • tendency”? • Mean • Median • Mode • Measures of variability • Range, Standard deviation and Variance • Memorizing the four definitional formulae
Schedule of readings Before next exam (February 10th): Please read chapters 1 - 4 & Appendix D, E & F online Please read Chapters 1, 5, 6 and 13 in Plous Chapter 1: Selective Perception Chapter 5: Plasticity Chapter 6: Effects of Question Wording and Framing Chapter 13: Anchoring and Adjustment
Homework Assignment #6 due Monday (February 6th) Please double check – Allcell phones other electronic devices are turned off and stowed away
Overview Frequency distributions The normal curve Challenge yourself as we work through characteristics of distributions to try to categorize each concept as a measure of 1) central tendency 2) dispersion or 3) shape Mean, Median, Mode, Trimmed Mean Standard deviation, Variance, Range Mean Absolute Deviation Skewed right, skewed left unimodal, bimodal, symmetric
A little more about frequency distributions An example of a normal distribution
A little more about frequency distributions An example of a normal distribution
A little more about frequency distributions An example of a normal distribution
A little more about frequency distributions An example of a normal distribution
A little more about frequency distributions An example of a normal distribution
Measure of central tendency: describes how scores tend to cluster toward the center of the distribution Normal distribution In all distributions: mode = tallest point median = middle score mean = balance point In a normal distribution: mode = mean = median
Measure of central tendency: describes how scores tend to cluster toward the center of the distribution Positively skewed distribution In all distributions: mode = tallest point median = middle score mean = balance point In a positively skewed distribution: mode < median < mean Note: mean is most affected by outliers or skewed distributions
Measure of central tendency: describes how scores tend to cluster toward the center of the distribution Negatively skewed distribution In all distributions: mode = tallest point median = middle score mean = balance point In a negatively skewed distribution: mean < median < mode Note: mean is most affected by outliers or skewed distributions
Mode: The value of the most frequent observation Bimodal distribution: Distribution with two most frequent observations (2 peaks) Example: Ian coaches two boys baseball teams. One team is made up of 10-year-olds and the other is made up of 16-year-olds. When he measured the height of all of his players he found a bimodal distribution
Overview Frequency distributions The normal curve Mean, Median, Mode, Trimmed Mean Standard deviation, Variance, Range Mean Absolute Deviation Skewed right, skewed left unimodal, bimodal, symmetric
5’ 7’ 6’ 6’6” 5’6” 5’ 7’ 6’ 6’6” 5’6” 5’ 7’ 6’ 6’6” 5’6” Variability The larger the variability the wider the curve tends to be The smaller the variability the narrower the curve tends to be
Dispersion: Variability 5’ 7’ 6’ 6’6” 5’6” 5’ 7’ 6’ 6’6” 5’6” 5’ 7’ 6’ 6’6” 5’6” Some distributions are more variable than others A Range: The difference between the largest and smallest observations B Range for distribution A? Range for distribution B? Range for distribution C? C
Fun fact: Mean is 72 Wildcats Baseball team: Tallest player = 76” (same as 6’4”) Shortest player = 68” (same as 5’8”) Range: The difference between the largest and smallest scores 76” – 68” = 8” Range is 8” (76” – 68”) xmax - xmin = Range Please note: No reference is made to numbers between the min and max
Fun fact: Mean is 78 Wildcats Basketball team: Tallest player = 83” (same as 6’11”) Shortest player = 70” (same as 5’10”) Range is 13” (83” – 70”) Range: The difference between the largest and smallest scores 83” – 70” = 13” xmax - xmin = Range
Frequency distributions The normal curve
Variability What might this be? Some distributions are more variable than others Let’s say this is our distribution of heights of men on U of A baseball team 5’ 7’ 6’ 6’6” 5’6” 5’ 7’ 6’ 6’6” 5’6” Mean is 6 feet tall What might this be? 5’ 7’ 6’ 6’6” 5’6”
5’ 7’ 6’ 6’6” 5’6” 5’ 7’ 6’ 6’6” 5’6” 5’ 7’ 6’ 6’6” 5’6” Variability The larger the variability the wider the curve the larger the deviations scores tend to be The smaller the variability the narrower the curve the smaller the deviations scores tend to be
Let’s build it up again…U of A Baseball team Diallo is 6’0” Diallo 5’8” 5’10” 6’0” 6’2” 6’4”
Let’s build it up again…U of A Baseball team Diallo is 6’0” Preston is 6’2” Preston 5’8” 5’10” 6’0” 6’2” 6’4”
Let’s build it up again…U of A Baseball team Diallo is 6’0” Preston is 6’2” Hunter Mike is 5’8” Mike Hunter is 5’10” 5’8” 5’10” 6’0” 6’2” 6’4”
Let’s build it up again…U of A Baseball team Diallo is 6’0” Preston is 6’2” David Mike is 5’8” Shea Hunter is 5’10” Shea is 6’4” David is 6’ 0” 5’8” 5’10” 6’0” 6’2” 6’4”
Let’s build it up again…U of A Baseball team Diallo is 6’0” Preston is 6’2” David Mike is 5’8” Shea Hunter is 5’10” Shea is 6’4” David is 6’ 0” 5’8” 5’10” 6’0” 6’2” 6’4”
Let’s build it up again…U of A Baseball team Diallo is 6’0” Preston is 6’2” Mike is 5’8” Hunter is 5’10” Shea is 6’4” David is 6’ 0” 5’8” 5’10” 6’0” 6’2” 6’4”
Let’s build it up again…U of A Baseball team 5’8” 5’10” 6’0” 6’2” 6’4” 5’8” 5’10” 6’0” 6’2” 6’4”
Variability Standard deviation: The average amount by which observations deviate on either side of their mean Generally, (on average) how far away is each score from the mean? Mean is 6’
Let’s build it up again…U of A Baseball team Deviation scores Diallo is 0” Diallo is 6’0” Diallo’s deviation score is 0 6’0” – 6’0” = 0 Diallo 5’8” 5’10” 6’0” 6’2” 6’4”
Deviation scores Diallo is 0” Let’s build it up again…U of A Baseball team Preston is 2” Diallo is 6’0” Diallo’s deviation score is 0 Preston is 6’2” Preston Preston’s deviation score is 2” 6’2” – 6’0” = 2 5’8” 5’10” 6’0” 6’2” 6’4”
Deviation scores Diallo is 0” Let’s build it up again…U of A Baseball team Preston is 2” Mike is -4” Hunter is -2 Diallo is 6’0” Diallo’s deviation score is 0 Hunter Preston is 6’2” Preston’s deviation score is 2” Mike Mike is 5’8” Mike’s deviation score is -4” 5’8” – 6’0” = -4 5’8” 5’10” 6’0” 6’2” 6’4” Hunter is 5’10” Hunter’s deviation score is -2” 5’10” – 6’0” = -2
Deviation scores Diallo is 0” Let’s build it up again…U of A Baseball team Preston is 2” Mike is -4” Hunter is -2 Shea is 4 David is 0” Diallo’s deviation score is 0 David Preston’s deviation score is 2” Mike’s deviation score is -4” Shea Hunter’s deviation score is -2” Shea is 6’4” Shea’s deviation score is 4” 5’8” 5’10” 6’0” 6’2” 6’4” 6’4” – 6’0” = 4 David is 6’ 0” David’s deviation score is 0 6’ 0” – 6’0” = 0
Deviation scores Diallo is 0” Let’s build it up again…U of A Baseball team Preston is 2” Mike is -4” Hunter is -2 Shea is 4 David is 0” Diallo’s deviation score is 0 David Preston’s deviation score is 2” Mike’s deviation score is -4” Shea Hunter’s deviation score is -2” Shea’s deviation score is 4” David’s deviation score is 4” 5’8” 5’10” 6’0” 6’2” 6’4”
Deviation scores Diallo is 0” Let’s build it up again…U of A Baseball team Preston is 2” Mike is -4” Hunter is -2 Shea is 4 David is 0” 5’8” 5’10” 6’0” 6’2” 6’4”
Deviation scores Standard deviation: The average amount by which observations deviate on either side of their mean Diallo is 0” Preston is 2” Mike is -4” Hunter is -2 Shea is 4 David is 0” 5’8” 5’10” 6’0” 6’2” 6’4”
Deviation scores Standard deviation: The average amount by which observations deviate on either side of their mean Diallo is 0” Preston is 2” Mike is -4” Hunter is -2 Shea is 4 David is 0” 5’8” 5’10” 6’0” 6’2” 6’4”
Σ(x - x) = 0 Deviation scores Standard deviation: The average amount by which observations deviate on either side of their mean Diallo is 0” Preston is 2” Mike is -4” Hunter is -2 Shea is 4 David is 0” Mike Σ x - x = ? Hunter 5’8” - 6’0” = - 4” 5’9” - 6’0” = - 3” 5’10’ - 6’0” = - 2” 5’11” - 6’0” = - 1” 6’0” - 6’0 = 0 6’1” - 6’0” = + 1” 6’2” - 6’0” = + 2” 6’3” - 6’0” = + 3” 6’4” - 6’0” = + 4” Diallo 5’8” 5’10” 6’0” 6’2” 6’4” How do we find the average deviation? Preston Σx / n = mean Σ(x - µ) = 0
Σ(x - x) Σ(x - x) = 0 Deviation scores Standard deviation: The average amount by which observations deviate on either side of their mean Diallo is 0” Preston is 2” Mike is -4” Hunter is -2 Shea is 4 How do we find the average deviation? David is 0” Square the deviations!! (and later take square root) Σx / n = mean Σ x - x = ? 2 5’8” - 6’0” = - 4” 5’9” - 6’0” = - 3” 5’10’ - 6’0” = - 2” 5’11” - 6’0” = - 1” 6’0” - 6’0 = 0 6’1” - 6’0” = + 1” 6’2” - 6’0” = + 2” 6’3” - 6’0” = + 3” 6’4” - 6’0” = + 4” 2 Σ(x - µ) How do we get rid of the negatives??!? Big problem!! Σ(x - µ) = 0
Standard deviation Standard deviation: The average amount by which observations deviate on either side of their mean Note this is for population standard deviation Fun Fact: Standard deviation squared = variance
Standard deviation Standard deviation: The average amount by which observations deviate on either side of their mean Note this is for sample standard deviation Fun Fact: Standard deviation squared = variance
Standard deviation: The average amount by which observations deviate on either side of their mean These would be helpful to know by heart – please memorize these formula
Thank you! See you next time!!