Download
1 / 13
130 likes | 233 Vues
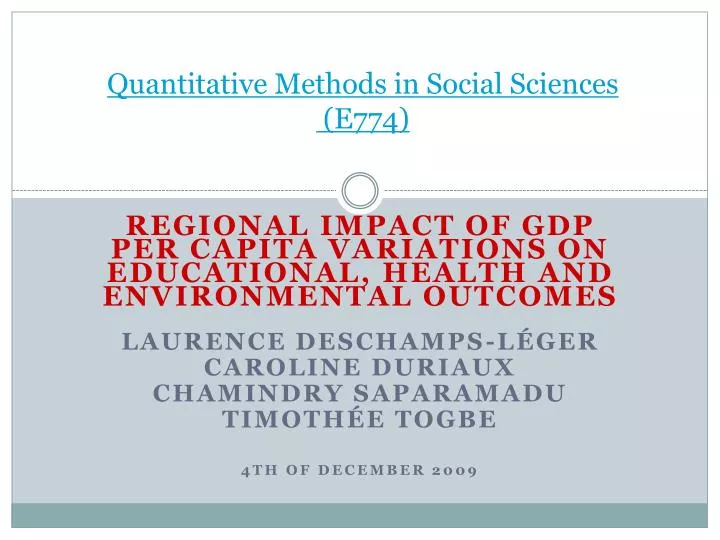
Quantitative Methods in Social Sciences (E774). Regional Impact of GDP per capita Variations on Educational , Health and Environmental Outcomes Laurence Deschamps-Léger Caroline Duriaux Chamindry Saparamadu Timothée Togbe 4th of December 2009. Part 1 Hypothesis.

E N D
Quantitative Methods in Social Sciences (E774) Regional Impact of GDP per capita Variations on Educational, Health and EnvironmentalOutcomes Laurence Deschamps-Léger Caroline Duriaux ChamindrySaparamadu Timothée Togbe 4th of December 2009
Part 1 Hypothesis • Issue to be discussed • How are GDP per capita variations across regions related to different educational, health and environmental outcomes? • Main Hypothesis • There is a relationship between GDP per capita variations across regions of the world and the educational, health and environmental outcomes such that, in general, a higher GDP per capita tends to be associated with better health and educational outcomes and more environmental degradation. • Understanding the dataset • Global data (comparisons across regions, not between countries) • Indicators • GDP per capita • Educational outcomes: adult literacy rates and gross enrolment ratio, public expenditures on education as % of GDP) • Health outcomes: life expectancy at birth, public expenditures on health as % of GDP) • Environmental outcomes: CO2 per capita • Validity & Reliability • Assuming validity and reliability of the quantitative data QM_MDEV_E774(2009)
Part 2 Statistical techniques DESCRIPTIVE STATISTICS • Describing center • Graphical comparison of regional means for each variable • Describing variability • Range • Standard deviation • Skewness INFERENTIAL STATISTICS • Sampling • For each region, working with all countries • Random sampling • Estimation and significance • Estimation for one proportion Two-sample mean t-test • One-sample mean t-test Ranked z-scores • One-sample mean z-test QM_MDEV_E774(2009)
Part 2 (cont’d) • Correlation • Simple linear correlation (Pearson’s): correlation coefficient (r) • Coefficient of Determination (r2) • Significance test for r • Regression • Linear regression for two variables • Predict y (dependent variable) from x (independent variable) • Find alpha & beta for the prediction equation (y=α+βx+ε) • Test of significance for the slope • Residuals: calculations of the mean • Outliers QM_MDEV_E774(2009)
Part 3 ResultsPolicy Paper 1 QM_MDEV_E774(2009)
Policy Paper 1- cont’d QM_MDEV_E774(2009)
Policy Paper 2 • GDP per capita Variations across Regions • GDP per capita and Education QM_MDEV_E774(2009)
Policy Paper 2 – Cont’d QM_MDEV_E774(2009)
Policy Paper 3 • Correlation Test and Prediction Equation • Health: Life Expectancy at Birth QM_MDEV_E774(2009)
Policy Paper 3 – cont’d • Statistical test of significance for coefficient of regression of life expectancy on GDPpc for Oceania & Polynesia Source | SS df MS Number of obs = 8 ------------------------------------------- F(1,6) = 15.40 Model | 325.784506 1 325.784506 Prob > F = 0.0078 Residual | 126.930549 6 21.1550915 R-squared = 0.7196 ------------------------------------------- Adj R-squared = 0.6729 Total | 452.715055 7 64.6735793 Root MSE = 4.5995 ------------------------------------------------------------------------------ le | Coef. Std. Err. t P>|t| [99% Conf. Interval] --------------------------------------------------------------------------- gdppc| .0006082 .000155 3.92 0.008 .0000336 .0011828 cons | 63.85978 2.342232 27.26 0.000 55.17612 72.54344 ------------------------------------------------------------------------------ QM_MDEV_E774(2009)
Part 4 Conclusions • What’s new about our approach? • Scientific approach combined with a critical approach to economic and social indicators of “progress” and “performance” • Focus on policy implications and recommendations • Emphasis on the limits of statistical tools and models • What did we learn from this exercise? • Benefits and challenges of group work • Use the relevant statistical tools in a development context • Always question the results • STATA • Policy implications • Strong need for multifaceted indicators • Avoid using statistics to justify policies • Usefulness of policy implications conditional to political will QM_MDEV_E774(2009)
Future work • Shortcomings of dataset • Outdated? • Missing values • Not looking at variations over time • Missing elements of research and analysis • No review of the existing literature • Observation and test of a limited number of variables • Regression analysis is incomplete • Possible areas of future research • Multivariate regression • Multidimensional and environmentally-sensitive indicators • Observing and testing relationships among countries of regions • Looking at specific cases (country-level) to validate or infirm global conclusions QM_MDEV_E774(2009)
Thank you! Merci! Sthuthi ! Enantchè! QM_MDEV_E774(2009)