Download
1 / 20
200 likes | 309 Vues
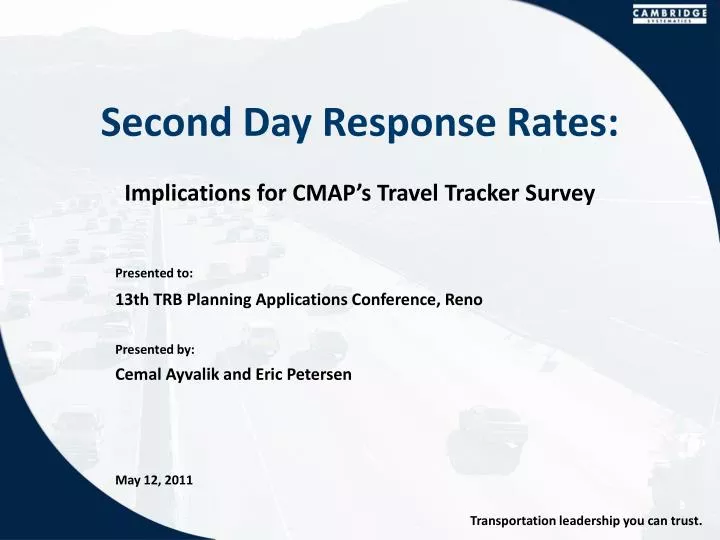
Second Day Response Rates: . Implications for CMAP’s Travel Tracker Survey. 13th TRB Planning Applications Conference, Reno. Cemal Ayvalik and Eric Petersen. May 12, 2011. Introduction. Many MPOs implement 2-day travel surveys Benefits:

E N D
Second Day Response Rates: Implications for CMAP’s Travel Tracker Survey 13th TRB Planning Applications Conference, Reno Cemal Ayvalik and Eric Petersen May 12, 2011
Introduction • Many MPOs implement 2-day travel surveys Benefits: • Statistical insights at a lower cost than surveying twice as many households. Risks: • Significant day-to-day variation in individual travel: • major activities at the tour level, • number of stops and duration, • scheduling of activities, • mode shifts • and route choice. • Respondent fatigue likely to bias the results.
Measuring Fatigue Clues for response fatigue. • Stop activities may be omitted on second day. • Work tours may be less affected than other travel purposes. • Issues possible in full chain of activities or omissions in maintenance or leisure activities on the second day. • Markers that might raise flags or minimize concern. • The respondent actually indicates whether the data is being read off hard copies of a travel diary or reported from memory. • One respondent providing information on all household members.
Correcting for Response Fatigue • Depending on the severity of the problem, there are a variety of options: • Discarding the entire record; • Discarding the second day and treating the first day as if it were one-day data; • Reweighting either the second day or both days; • Adjusting the existing data with respect to VMT or activity duration; • Synthesizing missing information. • However, modelers must know extent of the problem before making any adjustments or corrections.
Case study: Chicago Metropolitan Area • In the 2008Travel Tracker household survey conducted for the Chicago Metropolitan Agency for Planning (CMAP): • More than 14,300 households, 10,000+ in 6-County Area. • About 30 percent of households in 6-County area were asked about their travel activities over 2 days (over 3,100 households). • The rest responded via one-day travel diaries. • Is respondent fatigue an issue that leads to degradation in the data outweighing the advantage of 2-day surveys?
Tour Level Observations • Diaries from Typical Travel Day • Weekdays • Home-Based complete tours • Adults, Age 16 or Over • Work vs. Non-Work Tours
Testable Hypotheses • Hypothesis #1: Will respondent fatigue decrease the tour count and number of stops by tour type reported in 2-day surveys ? • Hypothesis #2: Will respondent fatigue decrease the tour count and number of stops by tour type reported on the second day? • Hypothesis #3: Will respondents reading from travel diaries suffer less fatigue? • Hypothesis #4: Will respondent fatigue increase as the number of household members increases?
Tour Level Comparisons • Reduction in number of tours and stops in tours is considered as an indicator of response fatigue. • Tours in the first day of 2-Day survey and the 1-Day survey are compared first. • Differences between the days in 2-Day survey were analyzed. • Completion of a log, household size and survey type are used as explanatory variables. • Number of tours and number of stops in a tour for work and non-work tours were dependent variables.
Tour Level Comparisons 1-Day vs. 2-Day Surveys
Tour Level Observations First vs. Second Day in 2-Day Survey
Summary of Results • Two different types of fatigue can be evaluated: • Fatigue across survey types (mix of single and multi day diaries). • Fatigue across survey days within multi-day surveys. Based on trip comparisons: • Less travel is reported by 2-day survey. • Less travel is reported on second day of 2-day survey. • Mandatory travel similar on first and second day. • Fewer non-mandatory stops on the second day.
Summary of Results Based on tours: H1: • Equivalent number of tours reported by survey type. • Fewer non-mandatory tours in the 2-day survey. • Complexity of mandatory tours seems to be increasing in 2-day survey. • Are shorter non-mandatory tours condensed into longer mandatory tours in reporting or is it due to day-to-day variation? H2: • No major differences between first and second day. • More mandatory tours reported in first day.
Summary of Results H3: • Shorter tours were observed from respondents who did not fill out a travel log. • The reason why they did not fill a diary is unknown. May be fatigue or the travel activity was actually short enough to recite from the memory. H4: • Larger households - higher tour count and more stops • Three-person households had unique patterns • More work tours • Primarily due to differences in member relationships and composition.
Next Steps • Day-to-day variation. • Unclear whether this is non-random. • Use GPS data to establish a degree of day-to-day variation. • Looking at the variation by different segments including: • household life cycles, • time of day, • activity patterns (linked activities, tours by complexity), • geography, and • data retrieval methods. • Matched-Pair Design to control for socioeconomics. • Model tour types and lengths using 1-Day survey data. • Cross-validate using 1-Day and 2-Day survey data.