Download
1 / 20
200 likes | 438 Vues
A precipitation seesaw mode between northeast Asia and Siberia in summer associated with Rossby waves over the Eurasian continent. K. Iwao* and M. Takahashi CCSR, University of Tokyo * Yatsushiro National College of Technology.

E N D
A precipitation seesaw mode between northeast Asia and Siberia in summer associated with Rossby waves over the Eurasian continent K. Iwao* and M. Takahashi CCSR, University of Tokyo * Yatsushiro National College of Technology This research was supported by “Global environment research fund” G-2 about Mongolian desertification.
Introduction: Climate over North East Asia is Precipitation distribution in summer (July) Elevation and 68 stations Sayanskiy Altai Hangayn Tian Shan Govi Tibet Taklamakan Precipitation seasonal variation ・Precipitation is concentrated in summer season(~70%) ・Low-precipitation is in deserts ・High-precipitation is to the north (rain-belt) over Mountain regions
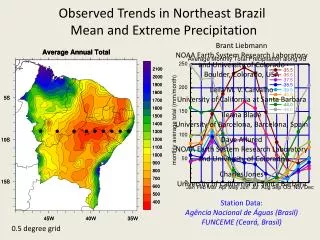
Climate change of precipitation over North-East Asia is seen increasing drought Bars; station data Lines; CMAP data JJA JUL Iwao and Takahashi, 2006, GRL ・ Data show Increasing trend from the 1980s to the 1990s ・ also show Drought for 1999-2002 → Enormous damages to livestock [Morinaga and Shinoda, 2003] Increase of dust events [Kurosaki and Mikami, 2003]
We found a precipitation north-south seesaw pattern from EOF analysis as a climate change over North-East Asia Correlation with upper atmosphere EOF1 of July Prec. ・A seesaw pattern between North- East Asia and Siberia can be seen. ・Correlation shows Rossby wave patterns over Northern Eurasia and over the Asian jet. Iwao and Takahashi, 2006, GRL
Purpose of present topics: ・to clarify the seesaw pattern: - We see Rossby waves over Northern Eurasia and over the Asian jet - The seesaw pattern is interpreted dynamically by the wavy structures - Origin of Rossby waves? - Budget analyses are also done - View of cyclone tracking difference analyses is discussed
There are many works about Rossby waves over Eurasia in summer 1: Rossby waves over Northern Eurasia e.g.,Wakabayashi and Kawamura [2004] Fukutomi et al. [2004] Nakamura and Fukamachi [2004] Sato and Takahashi [2004] Miyasaka and Kimoto [2005] … 2: Rossby waves over the Asian jet e.g.,Krishnan and Sugi [2001] Enomoto et al [2003] Wakabayashi and Kawamura [2004] Sato and Takahashi [2006] Iwasaki and Nii [2006] …
Here, we will take a combination of two teleconnection patterns related to summer Japan climate from Wakabayashi and Kawamura, JMSJ, 2004 over Northern Eurasia over the Asian jet Both wave patterns might be connected to a seasaw pattern between Mongolia and Siberia
An east-west seasaw mode over Siberia is obtained by Fukutomi et al., JGR, 2004 east-west seasaw mode high-pass 500hPa anomaly in East Siberia wet climate is different from east and west Siberia In their work, north-south seasaw pattern is also seen in East Siberia wet phase -> It might be connected to 2 wave trains over Siberia and the Asian jet
Longer Data and Method ・Precipitation:NCDC data → summertime mean(JJA) 1961-2004, 39 stations ・Meteorological fields: ERA40 (6-hourly) data → Low-frequency anomaly data = 10-day low-pass (daily – calendar mean)
How climate mean fields for Rossby wave guides are? 0 0 Local maxima of K can be wave-guides [Hoskins and Ambrizzi, 1993] K (global) 300 JJA K60N~6-8 K40N~8-10 EOF analysis for the low-frequency variation of v:meridional wind (30-150E, 40 60N, 300hPa, JJA1961-2002) is applied
VEOFs 1 and 2 are found and used for analyses λ60N~ 80° → k=4.5 → K=6.4 λ40N~ 60° → k=6 → K=8.5 ・Zonal wave numbers are consistent with estimated K ・The wave phases along two latitudes are opposite in Eastern Eurasia and closer toward the west ・VEOF2 is shifted eastward from VEOF1 by 1/4 wave length → both modes can explain zonal phase shift
Distributions of VEOFs to the seesaw pattern 7 high-precipitation years in Mongolia 7 high-precipitation years in Siberia JJA (1961-2001) VMG VSB Composite for each phase: events exceed 1std. more than 5-days → VMG(VEOF-indicating Mongolia rainfall event): 36 VSB (VEOF-indicating Siberia rainfall event): 35
Time evolution of composite fields VMG-case Z, WAF 300 hPa ・Eastward propagating Rossby waves branch off the north-south direction ・North-south opposite anomalies in Eastern Eurasia are due to the difference of wave length -8 day -4day Z300, Prcp 0 day Wave Activity Flux:Takaya and Nakamura [2001] Basic field = JJA climatology (1961-2002) Color: 95% significant
To see Origin of the Rossby wave: Low-pass filtered height variances at 300 hPa for JJA shows Blocking episode frequency for JJA(red line) between Jun 1996 and May 2001 from Pelly and Hoskins, 2003, JAS ・Wave source might be corresponding to frequent blocking around England in summer
Related vertical structures are like those Height(lines) and Temperature(color) anomalies VMG -2day D. and Va (90-120E) Siberia 60N Mongolia Mongolia Siberia 40N Conv. Div. latitude-height section ・Slight and large westward tilts in the upper and lower troposphere, respectively ・Meridional circulation is between North-East Asia and Siberia longitude-height section
Budget Analyses had been done C 200hPaVorticity budget shows advection 〜 streaching D [10-6/s・day] 500hPa Heat budget Vertical advection 〜 heating [K/day] 850hPa Vorticity budget D frictional 〜 streaching C [10-6/s・day]
Water vapor budget is estimated VMG -2day Integrated qU (vector) and the divergence (color) qU, condensation heating (color), and U divergence (contour) Mongolia Siberia [mm/day] cooling heating [10-3W/kg] ・North-East Asia: Condensation of water vapor from south ・Siberia: Water vapor flux is divergence
Precipitation over north-east Asia is related to traveling cyclonesThen, tracking analyses of cyclones are done Local minimum points of 500hPa heights Track ● generation points for tracks Shown tracks are only ones which pass the squared region as an example ・Frequent tracks of cyclones from West Siberia to northeast Mongolia ・Scarce tracks over arid and semiarid regions ・Frequent generation over north Mongolia and South Siberia Generation ・The cyclones pass frequently over northeast Mongolia due to traveling from the west and generation over north Mongolia.
Tracks for each case of the seesaw mode are calculated Tracks Difference High-prcp. (8-years) Low-prcp. (8-years) ・Cyclones pass over Mongolia frequently for high-precipitation summers ・The frequency of the traveling cyclones is suppressed over North-East Asia for low-precipitation summers.
Summary ・There is a precipitation seesaw mode between North-East Asia and Siberia, which represents an interannual variation of the summertime precipitation over North-East Asia. ・Summertime precipitation over North-East Asia increased from the 1980s to the 1990s, and a severe drought occurred for 1999-2002. ・The seesaw mode is interpreted by stationary waves propagating from the west over North-East Asia and Siberia. ・The frequency of the traveling cyclones is suppressed over North- East Asia for low-precipitation summers. C H L D L H D C Tibet