Download
1 / 25
250 likes | 459 Vues
The Capricorn Orogen Magnetotelluric (MT) Transect. Graham Heinson, Goran Boren, Jonathan Ross, Joan Campanya , Stephen Thiel and Katherine Selway University of Adelaide, Adelaide SA 5005 CAPRICORN SEISMIC and MT WORKSHOP 2011 Wednesday 23 rd November 2011

E N D
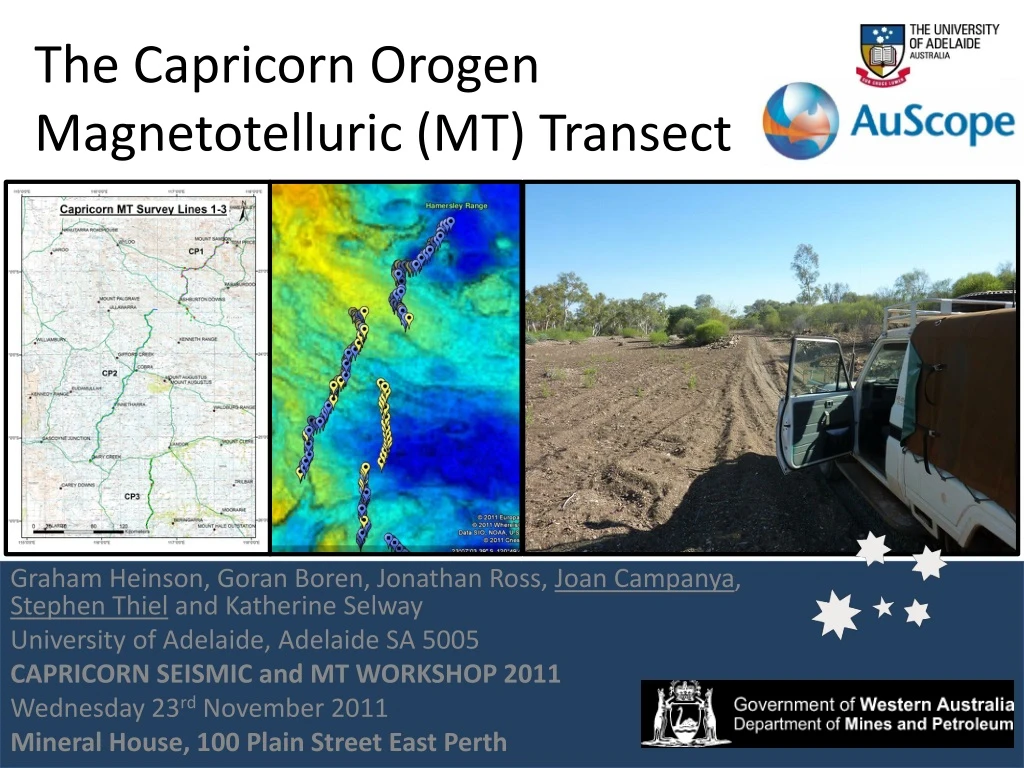
The Capricorn Orogen Magnetotelluric (MT) Transect Graham Heinson, Goran Boren, Jonathan Ross, Joan Campanya, Stephen Thiel and Katherine Selway University of Adelaide, Adelaide SA 5005 CAPRICORN SEISMIC and MT WORKSHOP 2011 Wednesday 23rd November 2011 Mineral House, 100 Plain Street East Perth
Capricorn MT Survey • 3 survey lines • 156 sites in total • CP1: 13 Long Period, 39 Broad Band • CP2: 19 Long Period, 55 Broad Band • CP3: 8 Long Period, 22 Broad Band Long period • Sampling rate: 10 Hz • Deployment time: 5 Days • Spacing: 15km Broad Band • Sampling rate: 1000 Hz • Deployment time 2-4 Days • Spacing: 5km
Selway et al. (2009) published long-period MT results from two lines This survey adds to the extent of the lines and also includes broad-band data at smaller sampling intervals.
TMI (left) and Gravity (right) profiles. Yellow circles: long-period MT; Blue circles: broad-band MT
Induction arrows: left from Selway et al. (2009). Below: from this survey
Red symbols: long-period MT Green symbols: Broadband MT Line CP1
Dimensionality Period 1s Northern line (CP1)
North South
CP1 Comments • MT Data are quite distorted (not 2D, very 3D) • Top 200 m conductive • Then resistive layer (103W.m) • Very conductive below 2 km (10 W.m – we’d normally expect 104W.m) • Appears to underlay all CP1 and northern CP2
Line CP2 Red symbols: long-period MT Green symbols: Broadband MT
Dimensionality Period 1s Center line (CP2)
North South
CP2 Comments • MT Data are distorted (not 2D, very 3D) • Very different crustal signature • North of dashed line upper crust is very conductive • South of dashed line, upper crust is much more resistive • Some evidence of conductive shear zones through crust
Line CP3 Red symbols: long-period MT Green symbols: Broadband MT
Dimensionality Period 1s Southern line (CP3)
South South North North Long-period MT model Low resolution < 25 km Broadband MT model Low resolution > 25 km
CP3 Comments • Much simpler data set, less distortion • Upper crust is much more “normal” • Conductive 10 W.m sediments to 200 m • Very conductive shear zone here • North of dashed line, crust is slightly more conductive • South of line, quite uniform
Conclusions • Errabiddy Shear Zone is clearly indentified in CP3. Zone of low resistivity • 10 km wide, and extends to at least 25 km • South-dipping, in both the low-resistivity shear zone, and also in the more resistive structures to the south
Conclusions • We do not resolve the depth and geometry of the Minnie Creek Batholith, but note that this is coincident with a profound change in the crustal resistivity along line CP2, which appears to be coincident with the Lyons River Fault.
Conclusions • Little in terms of basin structure and faults in the Pilbara-Hamersley-Ashburton Basin-Edmund Basin (CP1-CP2) • Low-resistivity structures observed at depths of 2-10 km • Simple interpretation of the low-resistivity due to highly-connected magnetite • Higher resistivity layers above have lower magnetite content, either due to the depth of weathering front, or due to intrusive bodies in the south
Acknowledgements • The Western Australian Government's Royalties for Regions Exploration Incentive Scheme (EIS) • Australia Federal Government's National Earth Science Infrastructure Program (AuScope) • GSWA and Geoscience Australia are thanked for significant logistical support for the MT fieldwork • The authors gratefully acknowledge pastoralists and Aboriginal communities for allowing us access to the land. • We are indebted to the many station owners along this profile that provided accommodation for the field crews and made the survey achievable in October and November.