Download
1 / 1
10 likes | 172 Vues
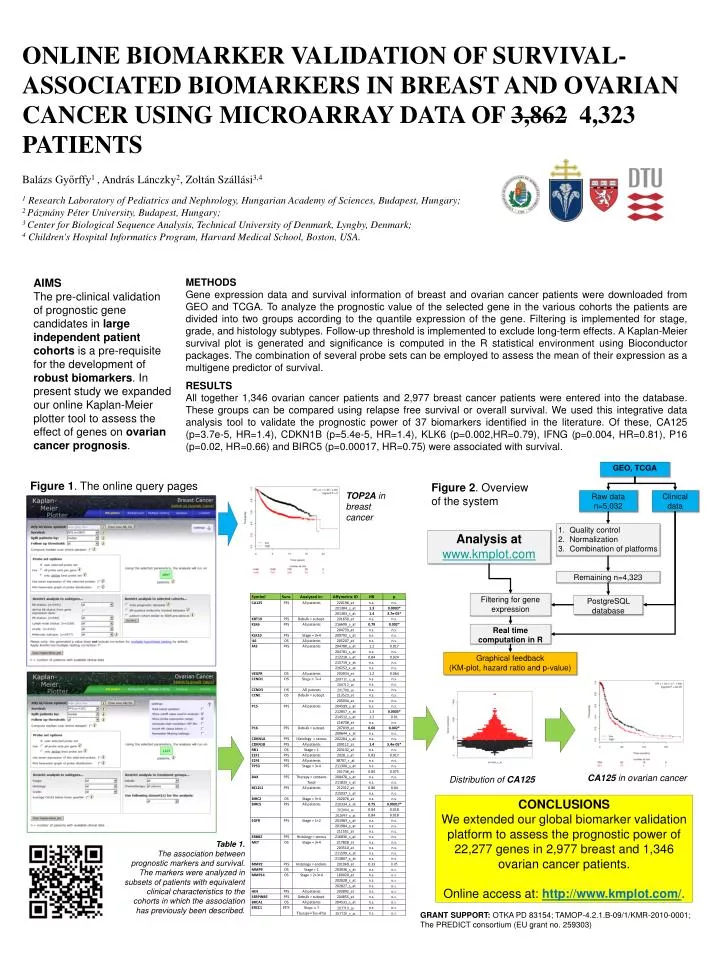
GEO, TCGA. Raw data n= 5,032. Clinical data. Quality control Normalization Combination of platforms. Analysis at www.kmplot.com. Remaining n=4,323. Filtering for gene expression. PostgreSQL database. Real time computation in R. Graphical feedback

E N D
GEO, TCGA Raw data n=5,032 Clinical data Quality control Normalization Combination of platforms Analysis at www.kmplot.com Remaining n=4,323 Filtering for gene expression PostgreSQL database Real time computation in R Graphical feedback (KM-plot, hazardratio and p-value) ONLINE BIOMARKER VALIDATION OF SURVIVAL-ASSOCIATED BIOMARKERS IN BREAST AND OVARIAN CANCER USING MICROARRAY DATA OF 3,862 4,323 PATIENTS Balázs Győrffy1 , AndrásLánczky2, ZoltánSzállási3,4 1 Research Laboratory of Pediatrics and Nephrology, Hungarian Academy of Sciences, Budapest, Hungary; 2 PázmányPéter University, Budapest, Hungary; 3Center for Biological Sequence Analysis, Technical University of Denmark, Lyngby, Denmark; 4 Children's Hospital Informatics Program, Harvard Medical School, Boston, USA. AIMS The pre-clinical validation of prognostic gene candidates in large independent patient cohorts is a pre-requisite for the development of robust biomarkers. In present study we expanded our online Kaplan-Meier plotter tool to assess the effect of genes on ovarian cancer prognosis. METHODS Gene expression data and survival information of breast and ovarian cancer patients were downloaded from GEO and TCGA. To analyze the prognostic value of the selected gene in the various cohorts the patients are divided into two groups according to the quantile expression of the gene. Filtering is implemented for stage, grade, and histology subtypes. Follow-up threshold is implemented to exclude long-term effects. A Kaplan-Meier survival plot is generated and significance is computed in the R statistical environment using Bioconductor packages. The combination of several probe sets can be employed to assess the mean of their expression as a multigene predictor of survival. RESULTS All together 1,346 ovarian cancer patients and 2,977 breast cancer patients were entered into the database. These groups can be compared using relapse free survival or overall survival. We used this integrative data analysis tool to validate the prognostic power of 37 biomarkers identified in the literature. Of these, CA125 (p=3.7e-5, HR=1.4), CDKN1B (p=5.4e-5, HR=1.4), KLK6 (p=0.002,HR=0.79), IFNG (p=0.004, HR=0.81), P16 (p=0.02, HR=0.66) and BIRC5 (p=0.00017, HR=0.75) were associated with survival. Figure 1. The online query pages Figure 2. Overview of the system TOP2A in breast cancer CA125 in ovarian cancer Distribution of CA125 CONCLUSIONS We extended our global biomarker validation platform to assess the prognostic power of 22,277 genes in 2,977 breast and 1,346 ovarian cancer patients. Online access at: http://www.kmplot.com/. Table 1. The association between prognostic markers and survival. The markers were analyzed in subsets of patients with equivalent clinical characteristics to the cohorts in which the association has previously been described. GRANT SUPPORT: OTKA PD 83154; TAMOP-4.2.1.B-09/1/KMR-2010-0001; The PREDICT consortium (EU grant no. 259303)