Download
1 / 13
130 likes | 305 Vues
KS5 Data Analysis. KS5 Performance Tables ALPS Report Data. KS5 Performance Tables. Tables published yearly Key thresholds include: Average Point Score Per Student Average Point Score Per Entry Achieving 2 or more & 3 or more A Levels

E N D
KS5 Data Analysis KS5 Performance Tables ALPS Report Data
KS5 Performance Tables • Tables published yearly • Key thresholds include: • Average Point Score Per Student • Average Point Score Per Entry • Achieving 2 or more & 3 or more A Levels • Tables split to show A Level w/without ‘equivalent qualifications’ • Year-on-year Comparison The most recent publication of the performance tables can be found at: www.education.gov.uk/schools/performance
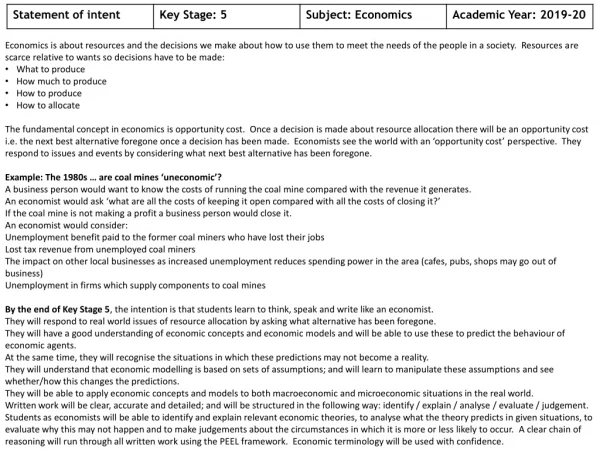
A level Results Looking at top-end results in a select list of subjects. Based on the findings of the ‘Russell Group’ who looked at entry to top universities. Facilitating subjects are: Mathematics and Further Mathematics, English (Literature), Physics, Biology, Chemistry, Geography, History, Languages (Classical and Modern). A Level Grades: 300 = A*, A = 270, B = 240, C = 210, D = 180, E = 150
A level and other academic qualification results Presently, this table is used for the National Comparison A level and equivalent results A Level Grades: 300 = A*, A = 270, B = 240, C = 210, D = 180, E = 150
Year on year comparisons (including equivalences) A Level Grades: 300 = A*, A = 270, B = 240, C = 210, D = 180, E = 150
2013-14 ReformsTaken from DFE ‘Statement of Intent 2013’ • 25. Building on from cohort changes last year, the 2013 performance tables will report vocational and academic performance separately.Therefore, results for A levels with other KS5 equivalences will no longer be published. This means we will publish three performance categories which will report results for A leveIs; A level and other advanced academic qualifications; and advanced vocational qualifications. These indicators will show the proportion of students at each school or college studying these qualifications. • 27. The 16-18 performance tables will also include value added results for A leveIs; A level and other advanced academic qualifications; and advanced vocational qualifications.The release of these data for the 2013 tables is subject to further analysis. http://www.education.gov.uk/schools/performance/download/Statement_of_Intent_2013.pdf
ALPS • Nationally recognised system, widely used to analyse results • Generated from our Examination Results (usually within 2 weeks) • Provides various reports that look at results • performance in comparison to students’ KS4 ability bands • student level breakdown • subject level breakdown • provides indicators for performance against National Data
KEY: Hit target grade or better = RED , 1 grade down = GREY , 2 grades down or more = BLUE Don’t be caught out by the colour coding! This is one example of the student performance tables that ALPS provides. It compares student’s ALPS set target against what grade they actually achieved. ALPS Report (page 78): “Alps A level programme students only - Student Performance”
This table looks at A Level grades achieved in comparison to student’s KS4 average point score (APS). At GCSE an APS above 46 is average grade C, 40 a grade D, 34 grade E. Remember that RED is good and BLUE is bad ALPS Report (page 39): “Alps A level - Analysis of students banded by ability - current year”
This table shows student’s ‘raw’ marks by subject, alongside the KS4 APS. ALPS Report (page 35): “Alps A level - Raw results”.
ALPS ‘Value Added’ (VA) Scores can be used to track subject performance year-on-year. ALPS Report (page 47): “Alps A level - Subject value added overview”.
Conclusion • DFE performance tables are published annually and contain the results that we are held accountable for. • Reforms to the KS5 tables in coming years will continue to place more emphasis on Academic A-Levels. • ALPS can be used to look at more detailed subject and student level data. • Subject performance and individual student case studies can be identified.