Download
1 / 11
110 likes | 288 Vues
Core 30 Airport Weather Impact Assessment. Edward Hahn 22 July 2014. Core Airport Service Analysis Research. First study to examine forensically all weather phenomena at Core Airports (previous studies typically narrow in scope) Incorporate traffic operations with weather event climatology

E N D
Core 30 Airport Weather Impact Assessment Edward Hahn 22 July 2014
Core Airport Service Analysis Research • First study to examine forensically all weather phenomena at Core Airports (previous studies typically narrow in scope) • Incorporate traffic operations with weather event climatology • Identify how traffic and weather combine to impact terminal ops • Objective: identify and rank weather impacts on operations at Core 30 airports for each of the following weather phenomena: • Thunderstorms/Heavy Rain • Low Ceiling and Visibility • IFR (CIG <1000 ft and/or VIS <3 SM) • MVFR (CIG 1000-3000 ft and/or VIS 3-5 SM) • Strong Winds (>20 kts) (includes component for crosswinds analysis) • Winter Weather (combination of snow, freezing rain, and ice pellets) • Identify Shortfalls due to Weather Impact • By airport, phenomenon, season, etc. • Provides “Pool of Benefits” and input on prioritization
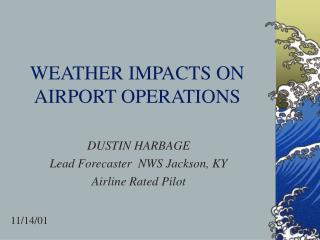
Why is this Study Necessary? • Terminal weather of varying types disrupts, delays, and even prevents NextGen-enabled operations • Current decision support capabilities are often unable to take weather into account • Reduces their usefulness during operations which would benefit the most from decision support • Future NextGen capabilities will need to be weather-aware • Strategic: how will airports be affected (AAR/ADR) by different weather phenomena? How will that affect flow management and metering operations? • Tactical: when will wind conditions change at an airport? How can departure reservoir management be performed accurately in the face of a pending runway reconfiguration? • Which airports – and under what specific conditions – do targeted capabilities require enhanced weather translation for constraint identification / resolution?
Measuring Weather Impacts Relative to “No-Weather” Baseline • ‘No Weather Baseline’: • Ensures weather impact analysis is isolated from delay typically present as part of “normal” daily airport operations (not associated with weather) • Provides a control group to perform comparative research • Assessed as rolling 3-hr average, computed hourly (rather than entire day or longer periods) to account for variation in airport demand, arrival vs. departure operations and peak periods, etc. • Completed no weather baseline on a per airport per hour basis (binned in 3-hr increments) for the following metrics: • Arrival/Departure Counts • Taxi In/Taxi Out Times • Delay for Departures/Arrivals *Note: Analysis can be further broken down on a seasonal, monthly, daily, hourly, etc. basis as needed and can be calculated for all operational metrics
Key Points: • DFW is the most impacted airport: high Departure Delays accompanied by Departure Deficits due to early morning (09z-12z) and afternoon/evening (21z-00z) thunderstorm impact • LGA, EWR, and PHL experience similar problems in terms of Arrival/Departure Delays due complexity and congestion of airspace as well as thunderstorm impact during high demand hours (18z-00z) • ORD is more impacted than MDW in all metrics due to demand and timing of convection (specifically 22z-05z when thunderstorm frequency and traffic demand are both at their highest) • Size and complexity of airport contribute to this as well (ORD-Taxi In time) Thunderstorms/Heavy Rain Results Relative Ranking Denotes highest ranking airport per metric NOTE: An in-depth analysis of these (and other) impacts is provided in the accompanying Core 30 Airport Weather Impact report
Ceiling & Visibility: MVFR Results (CIG 1000-3000 ft and/or VIS 3-5 SM) • Key Points: • The majority of the impacts per metric are low • LGA, EWR, and PHL continue to exhibit similar operational impact characteristics (Arrival/Departure Delay and Arrival/Departure Deficit) due to similarities in demand and climatology • Seen with IFR conditions as well • SFO, 18th for overall IFR ranking, jumped to 4th for MVFR ranking Relative Ranking Denotes highest ranking airport per metric NOTE: An in-depth analysis of these (and other) impacts is provided in the accompanying Core 30 Airport Weather Impact report
Ceiling & Visibility: IFR Results (CIG <1000 ft and/or VIS <3 SM) • Key Points: • LGA, PHL, and EWR experience similar impacts across all metrics – all three airports have similar climatology in regards to IFR conditions and similar demand profiles (significant jump in demand after 12z) • ORD ranks 2nd due to Arrival/Departure Deficits • ATL ranks 1st in overall occurrences – most IFR conditions occur during the morning hours (06z-12z) when traffic first begins to increase, hence impacts to Arrival/Departure Delay • LAS and PHX rank 8th and 10th, however small sample size (LAS 15, PHX 14) means caution required when interpreting results Denotes highest ranking airport per metric NOTE: An in-depth analysis of these (and other) impacts is provided in the accompanying Core 30 Airport Weather Impact report
Winds >20 kts: Results • Key Points: • EWR and LGA are impacted similarly across all metrics. Impact for Arrival/ Departure Delays begins around 12z when wind speeds greater than 20 kts are the most prevalent (12z-18z) • SFO experiences the highest number of crosswinds; winds >20 kts occur most often between 12z-21z (coincident with high demand) • CLT ranks 2nd in overall impact • Caution: Likely associated with limited sample size Relative Ranking Denotes highest ranking airport per metric NOTE: An in-depth analysis of these (and other) impacts is provided in the accompanying Core 30 Airport Weather Impact report
Northeast WX-Impact Classification Tree BOS JFK EWR Arrival Operations Surface Operations Departure Operations Surface Operations Departure Operations Arrival Operations Surface Operations Departure Operations Arrival Operations LGA PHL Arrival Operations Arrival Operations Surface Operations Departure Operations Surface Operations Departure Operations
Southeast WX-Impact Classification Tree ATL MCO FLL Arrival Operations Arrival Operations Surface Operations Departure Operations Surface Operations Departure Operations Arrival Operations Surface Operations Departure Operations MIA TPA Arrival Operations Arrival Operations Surface Operations Departure Operations Surface Operations Departure Operations
Airport Impact Classification Tree (2 of 2) Focus Impact Assessment for Specific Ops Decisions/ Procedures Results may be extended to various aspects of three key airport operations management areas including: Airport Arrival Operations Surface Operations Departure Operations • Runway Configuration Management • Taxi / Ramp Operations • Management • Taxi-queue mgmt / optimization • (‘surface metering’; TFDM) • Effective Execution of Impact • mgmt Programs (e.g., GDPs / GSs) • Runway Treatment / Clearing • Deicing / anti-icing ops • Capacity Management • AAR Optimization • Constraint ID / Resolution • Effective Execution of • Impact Mgmt Programs • (e.g., GDPs / GSs) • Airport ‘Node’ Viability in • TBFM ‘Network’ (e.g., TMA) • Capacity Management • ADR Optimization; • Balancing Arr / Dep Ops • Constraint ID / Resolution • Effective Execution of • Impact Mgmt Programs • (e.g., GDPs / GSs) • TBFM Departure ‘Scheduling’ • for metered ops (e.g., IDAC)